Next Section | Table of Contents
doi:10.2204/iodp.pr.312.2006
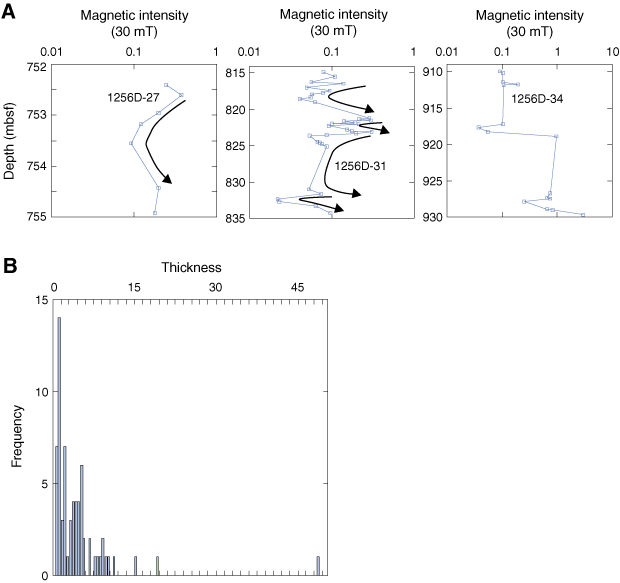
Figure F55. A. Examples of intensity variation in demagnetized archive-half samples that correlate with petrographic igneous units; from left to right: single behavior, multiple behavior, and irregular behavior. B. Histogram showing frequency of thickness (m) of concave shapes.
