Next Section | Table of Contents
doi:10.2204/iodp.pr.312.2006
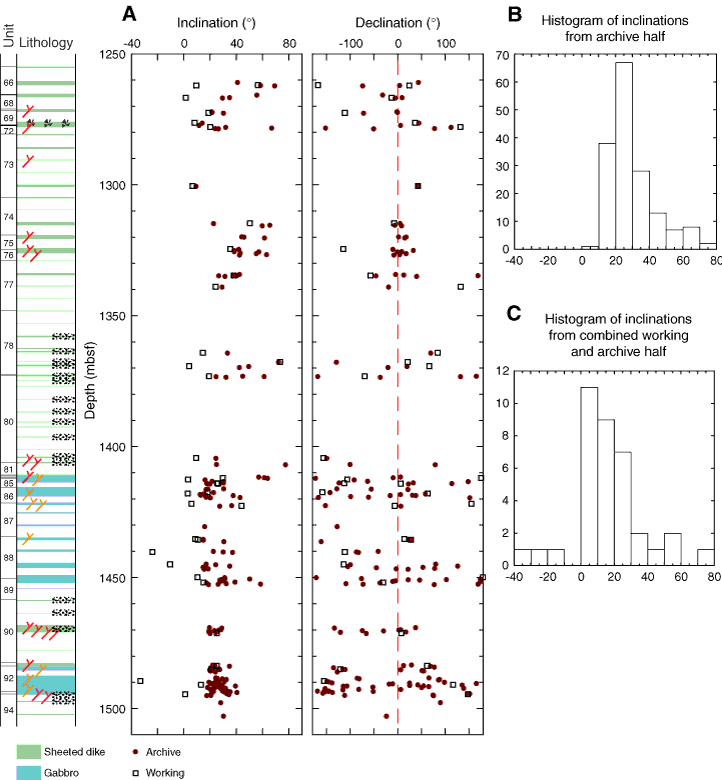
Figure F58. A. Inclination and declination versus depth, with last good demagnetized direction plotted for the archive half and directions from intersection analysis, where well constrained, used for the working half. B, C. Histograms of inclination data. The three negative inclinations are from intersection analysis.