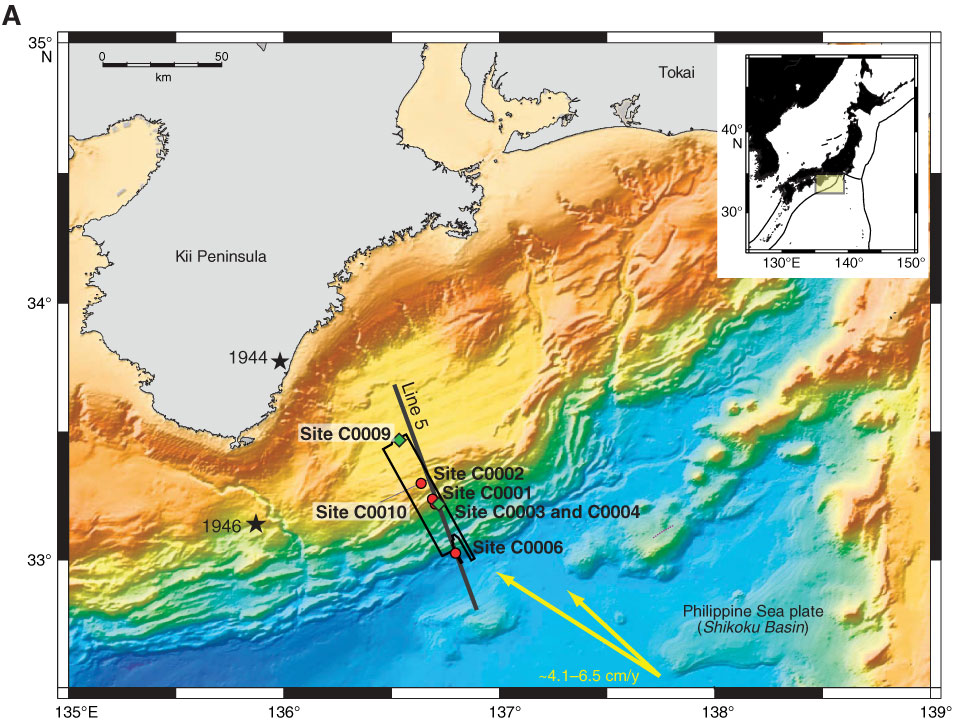
Figure F1. A. Map of study area showing drill sites. Green squares = Expedition 319, red circles = NanTroSEIZE Sate 1, black box = location of 2006 three-dimensional seismic reflection data acquisition, black line = KR0108-5 two-dimensional seismic profile, yellow arrows = estimated far-field vectors between Philippine Sea plate and Japan (Seno et al., 1993; Heki, 2007), stars = epicentral location of great earthquakes. Inset shows location of Nankai Trough around the drill sites. (Continued on next page.)