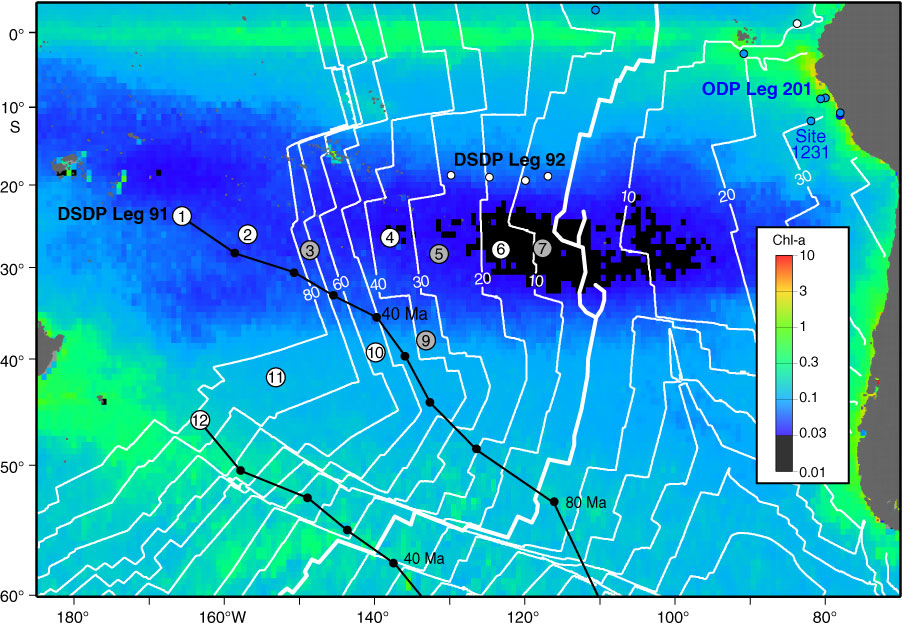
Figure F1. Map of annual chlorophyll-a (Chl-a) concentrations overlain by the proposed site locations (circled numbers; corresponds to site number). White lines = basement age in 10 m.y. increments. As illustrated by paleoposition histories of proposed Sites SPG-1 and SPG-12 (black lines), paleopositions determined with a fixed hotspot reference frame indicate that proposed Sites SPG-1–SPG-10 have been in the gyre for tens of millions of years and proposed Site SPG-12 has been at the gyre margin for tens of millions of years.
Close | Next | Top of page