Previous | Close | Next
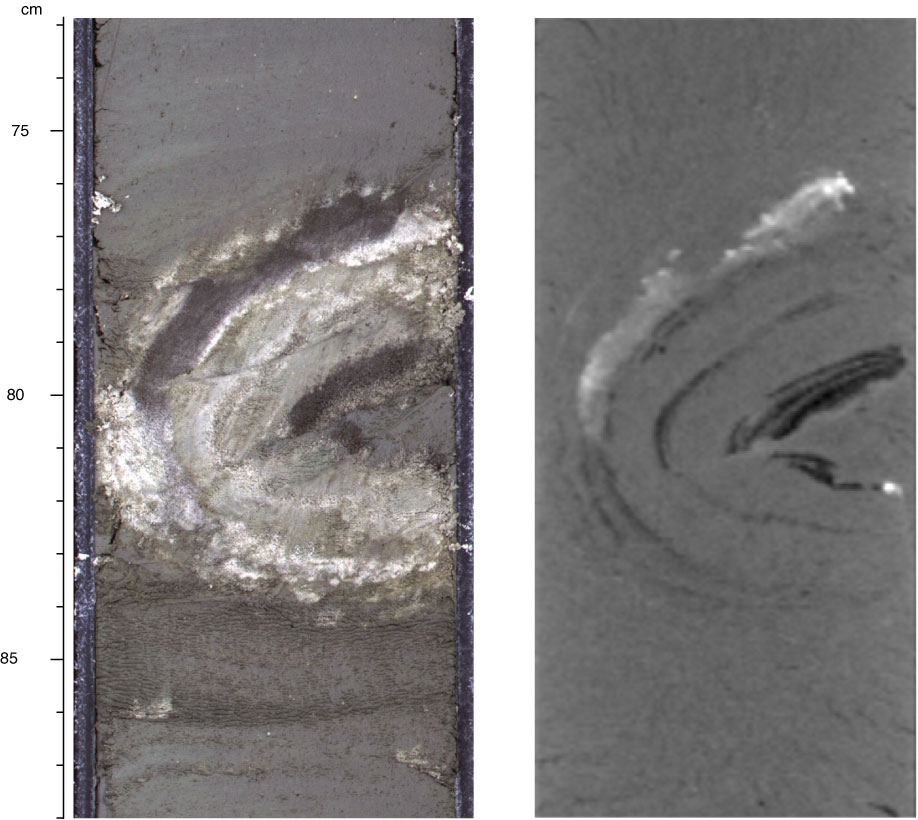
Figure F14. Appearance of slump fold (interval 333-C0018A-5H-6, 73–88 cm) on core photo (left) and CT scan (right) image.
Previous | Close | Next | Top of page