Previous | Close | Next
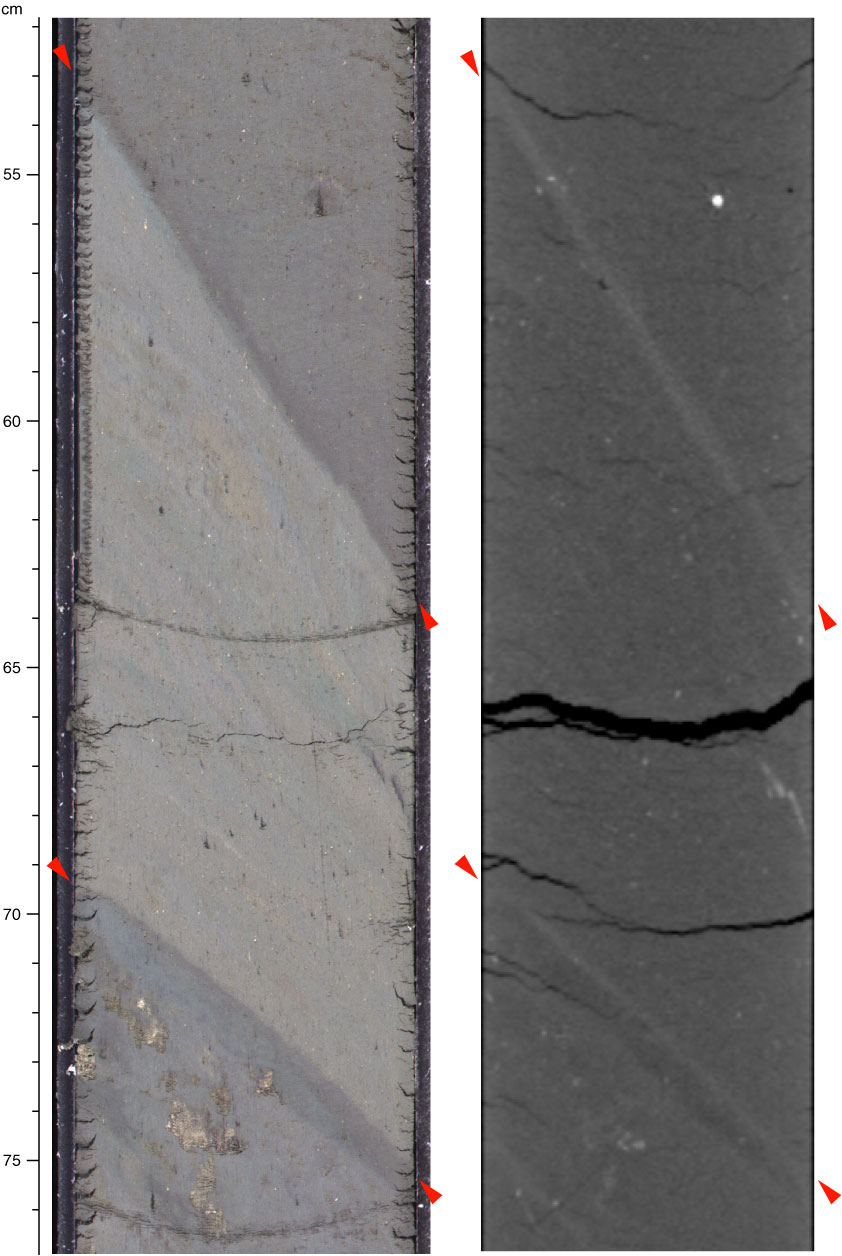
Figure F15. Appearance of shear zone (interval 333-C0018A-17H-6, 53–76 cm) on core photo (left) and CT scan (right) image. Red triangles = location of shear zones.
Previous | Close | Next | Top of page