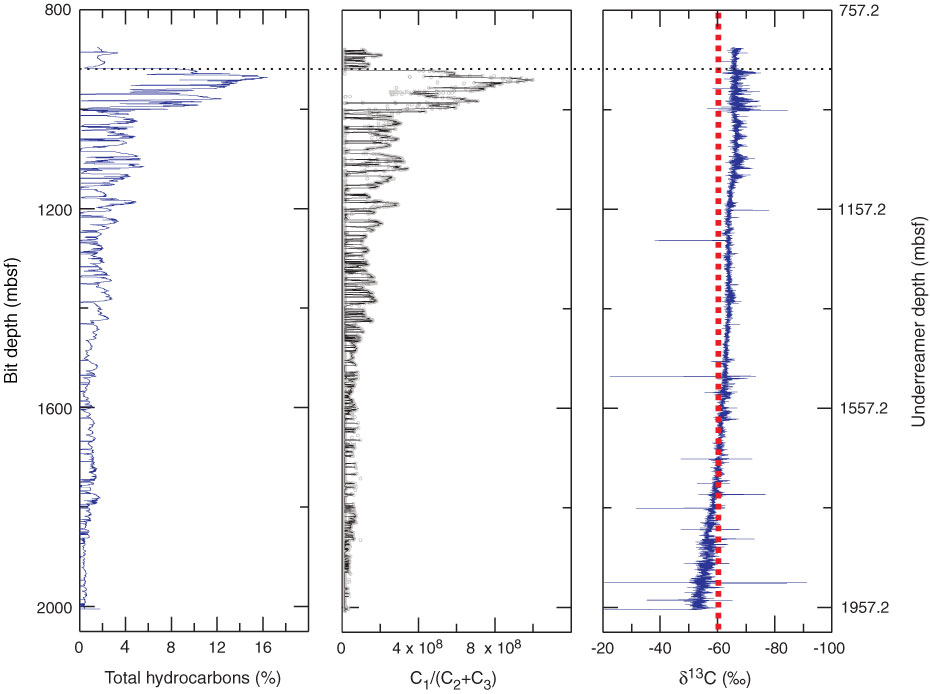
Figure F14. Selected results from mud-gas monitoring during riser drilling, Hole C0002F. Total hydrocarbon gas and C1/(C2 + C3) data are provided by Geoservices. δ13C values were measured using the methane carbon isotope analyzer (MCIA). For better visualization, only C1/(C2 + C3) based on significant amounts of ethane and/or propane (i.e., >0.0001%) are plotted. Red dotted line in the δ13C plot = beginning of a thermogenic signature (greater than –60‰ at ~1700 mbsf). A clear boundary at 918 mbsf is defined in the gas data and correlates to the logging Unit III/IV boundary.
Previous | Close | Next | Top of page