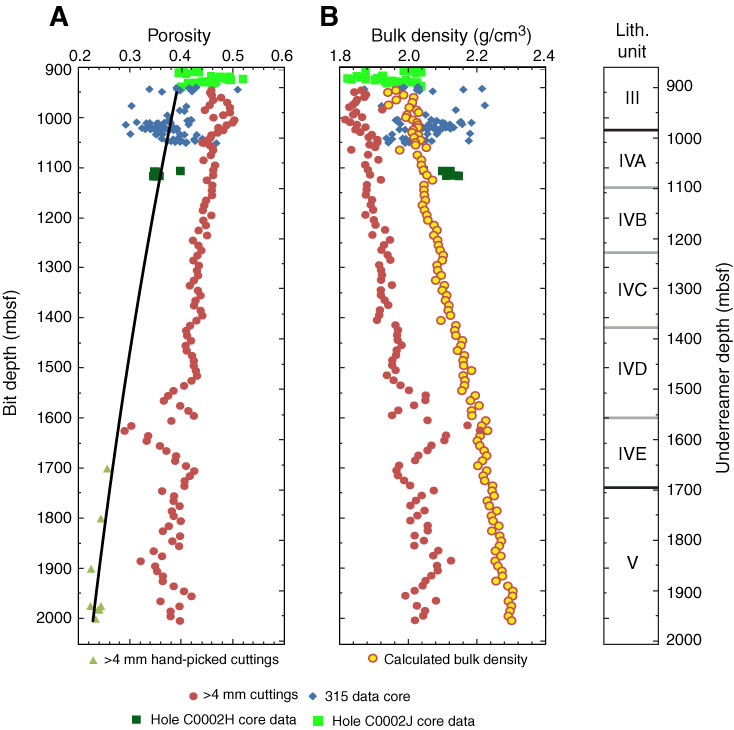
Figure F15. A. Compiled MAD porosity data from Hole C0002B (blue diamonds; Expedition 315 Scientists, 2009), Hole C0002H and C0002J core data and hand-picked samples of intact formation cuttings >4 mm compared with porosity determined from Hole C0002F bulk cuttings >4 mm (red dots). Black line = Athy model best fit to Expedition 315 and hand-picked data. B. MAD bulk density data from bulk cuttings >4 mm (red dots) in comparison with bulk density calculated from Athy model porosity (yellow circles). Lithologic units and underreamer depth are shown as a reference.
Previous | Close | Next | Top of page