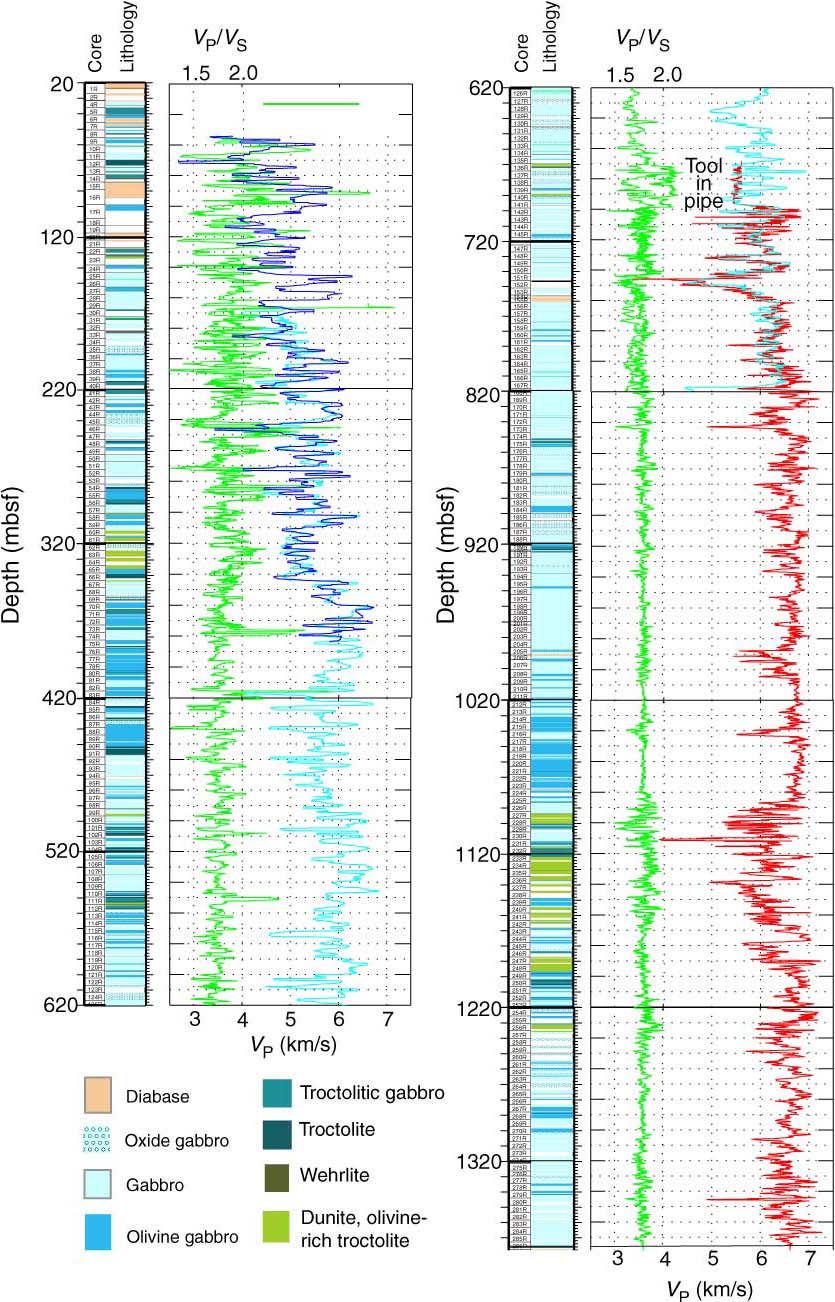
Figure F18. Correlation of downhole sonic velocity and lithology. VP shown for each of the Hole U1309D logging phases (blue = Expedition 304, cyan = Expedition 305, red = Expedition 340T. Scale at bottom). Green = VP/VS ratio for all three logging runs (scale at top).
Previous | Close | Next | Top of page