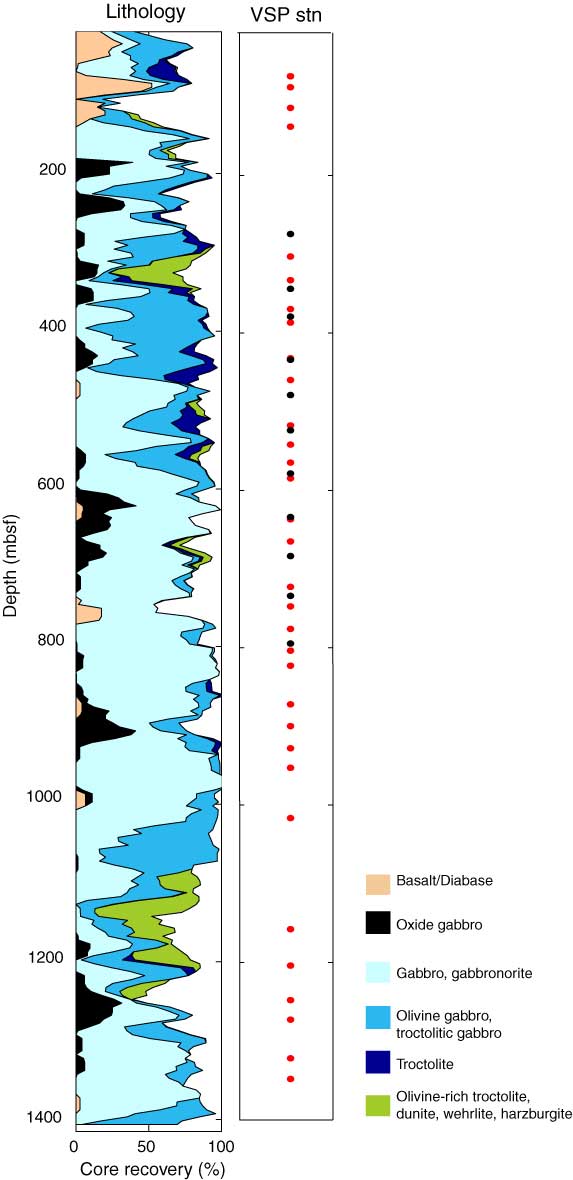
Figure F19. Downhole lithology in Hole U1309D (20 m average) and location of vertical seismic profile (VSP) stations determined to have useful data. Red dots = Expedition 340T stations, black dots = Expedition 305 stations.
Previous | Close | Next | Top of page