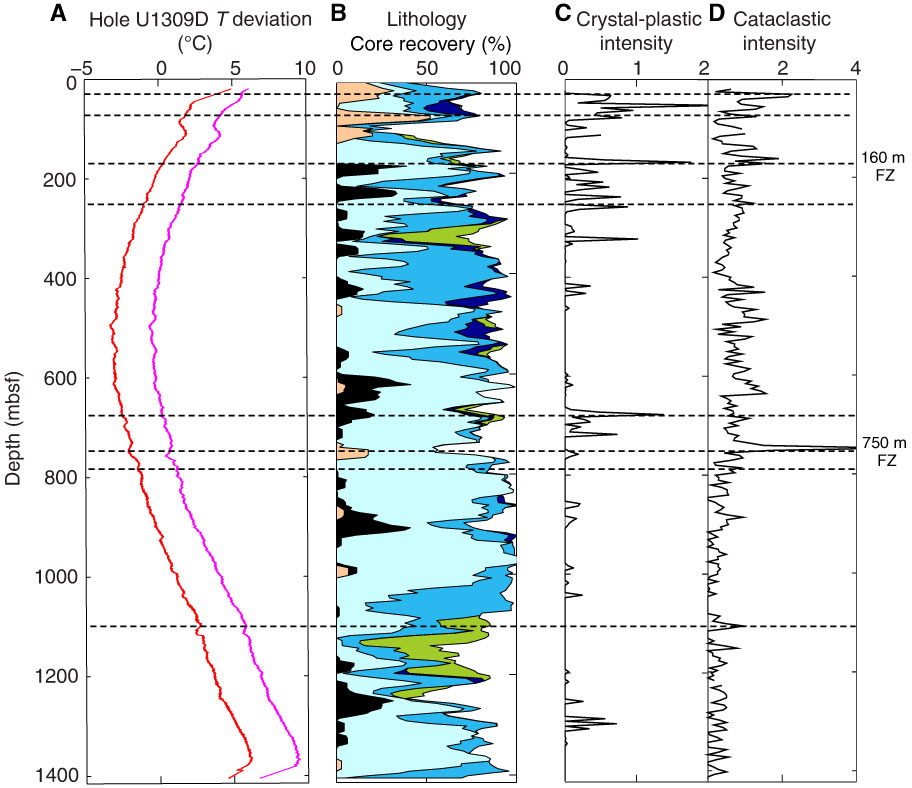
Figure F20. Correlation of downhole temperature (T), lithology, and structure, Hole U1309D. A. Deviation of Expedition 340T temperature from simple conductive model. B. Core lithology. C. Crystal-plastic deformation structures observed in Hole U1309D core. Intensity scale: 0–5 (low–high). D. Cataclastic structures observed in Hole U1309D core. Dashed horizontal lines = locations of fazones (FZ) inferred from core structure and, in some intervals, Expeditions 304/305 logging data.
Previous | Close | Top of page