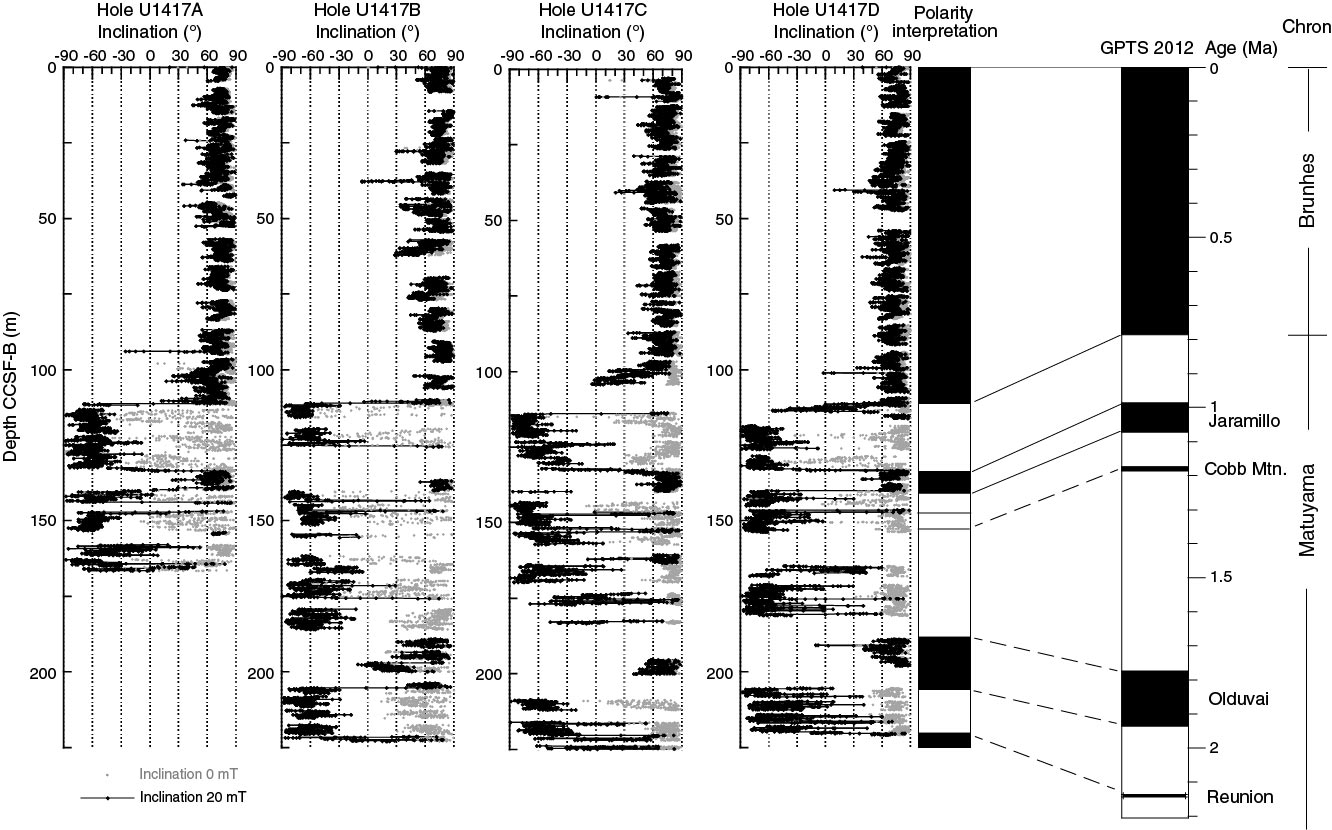
Figure F31. Inclination and polarity interpretations before (light dots) and after (black dots) peak AF demagnetization at 20 mT of the APC-recovered intervals, Site U1417. Polarity interpretation and correlation to the GPTS 2012 (Hilgen et al., 2012) is described in the text.
Previous | Close | Next | Top of page