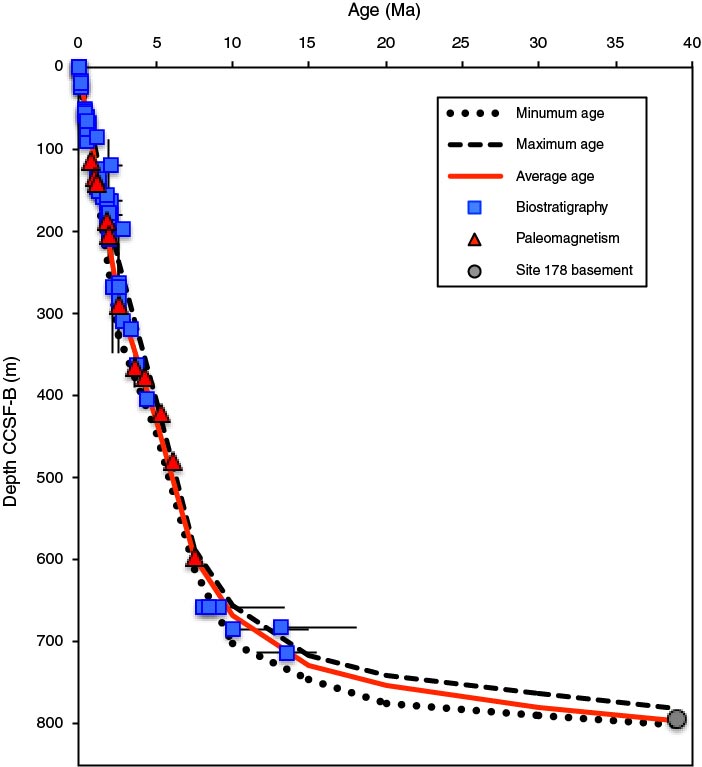
Figure F32. Shipboard age model, Site U1417. The two dashed curves represent the minimum and maximum initial age models described in the text. Ages are established for 2.5 m.y. intervals from 0 to 10 Ma, 5 m.y. intervals from 10 to 20 Ma, and a 10 m.y. interval from 20 to 30 Ma.
Previous | Close | Next | Top of page