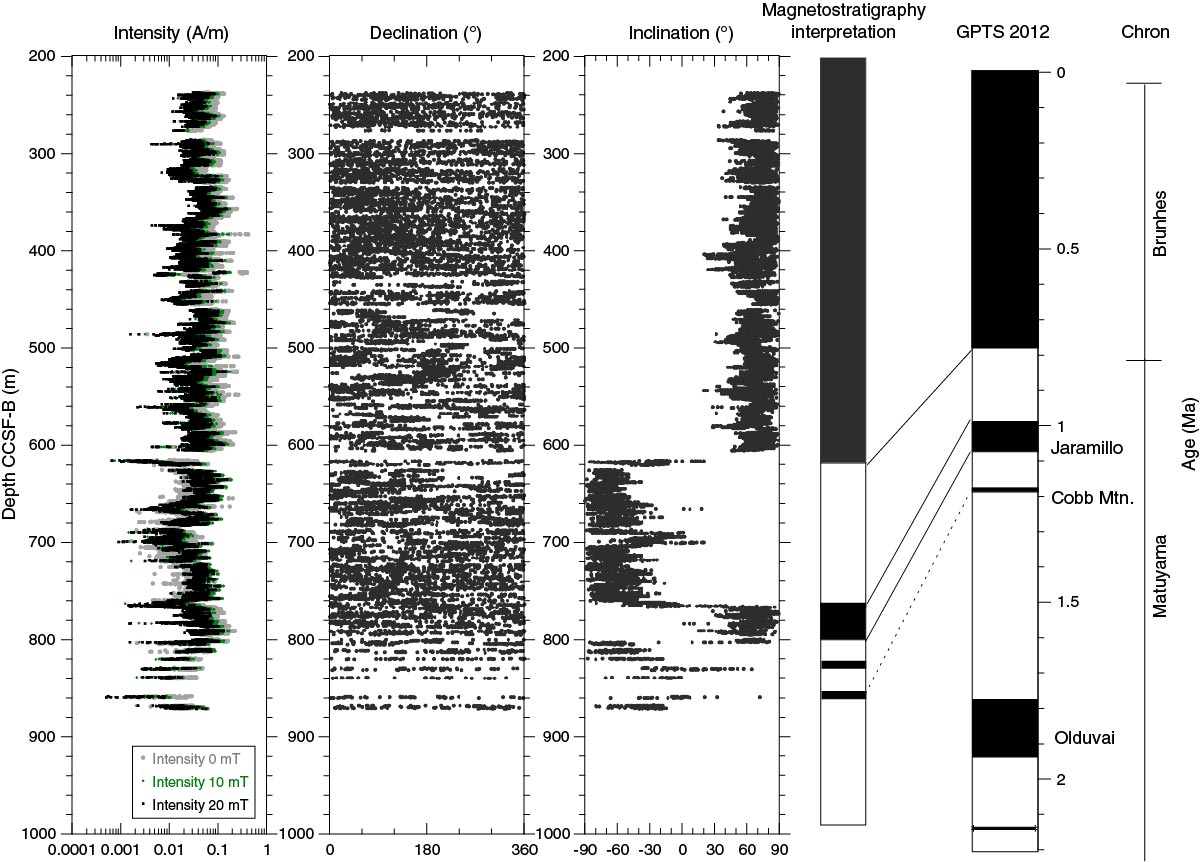
Figure F44. Intensity measured before and after 10 and 20 mT demagnetization, Hole U1418F. Declination and inclination measured after 20 mT peak AF demagnetization are also shown. GPTS 2012 from Hilgen et al. (2012). The bottom three Cores 341-U1418F-70R through 72R of mass transport deposit as chaotic unit are not included, though their intensities are similar.
Previous | Close | Next | Top of page