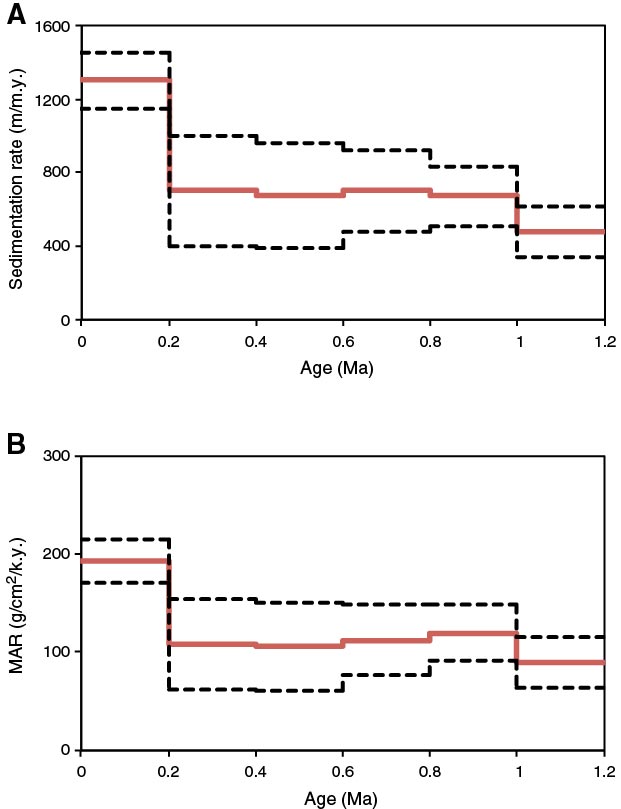
Figure F45. (A) Shipboard sedimentation rate and (B) mass accumulation rates (MAR) for Site U1418, based on the CCSF-B depth model, the shipboard age models, and interval-averaged discrete dry density data. Values are calculated over 0.2 m.y. intervals from 0 to 1.2 Ma. Solid lines = averages within each interval, dashed lines = uncertainty bounds (minimum and maximum rates based on shipboard age models).
Previous | Close | Next | Top of page