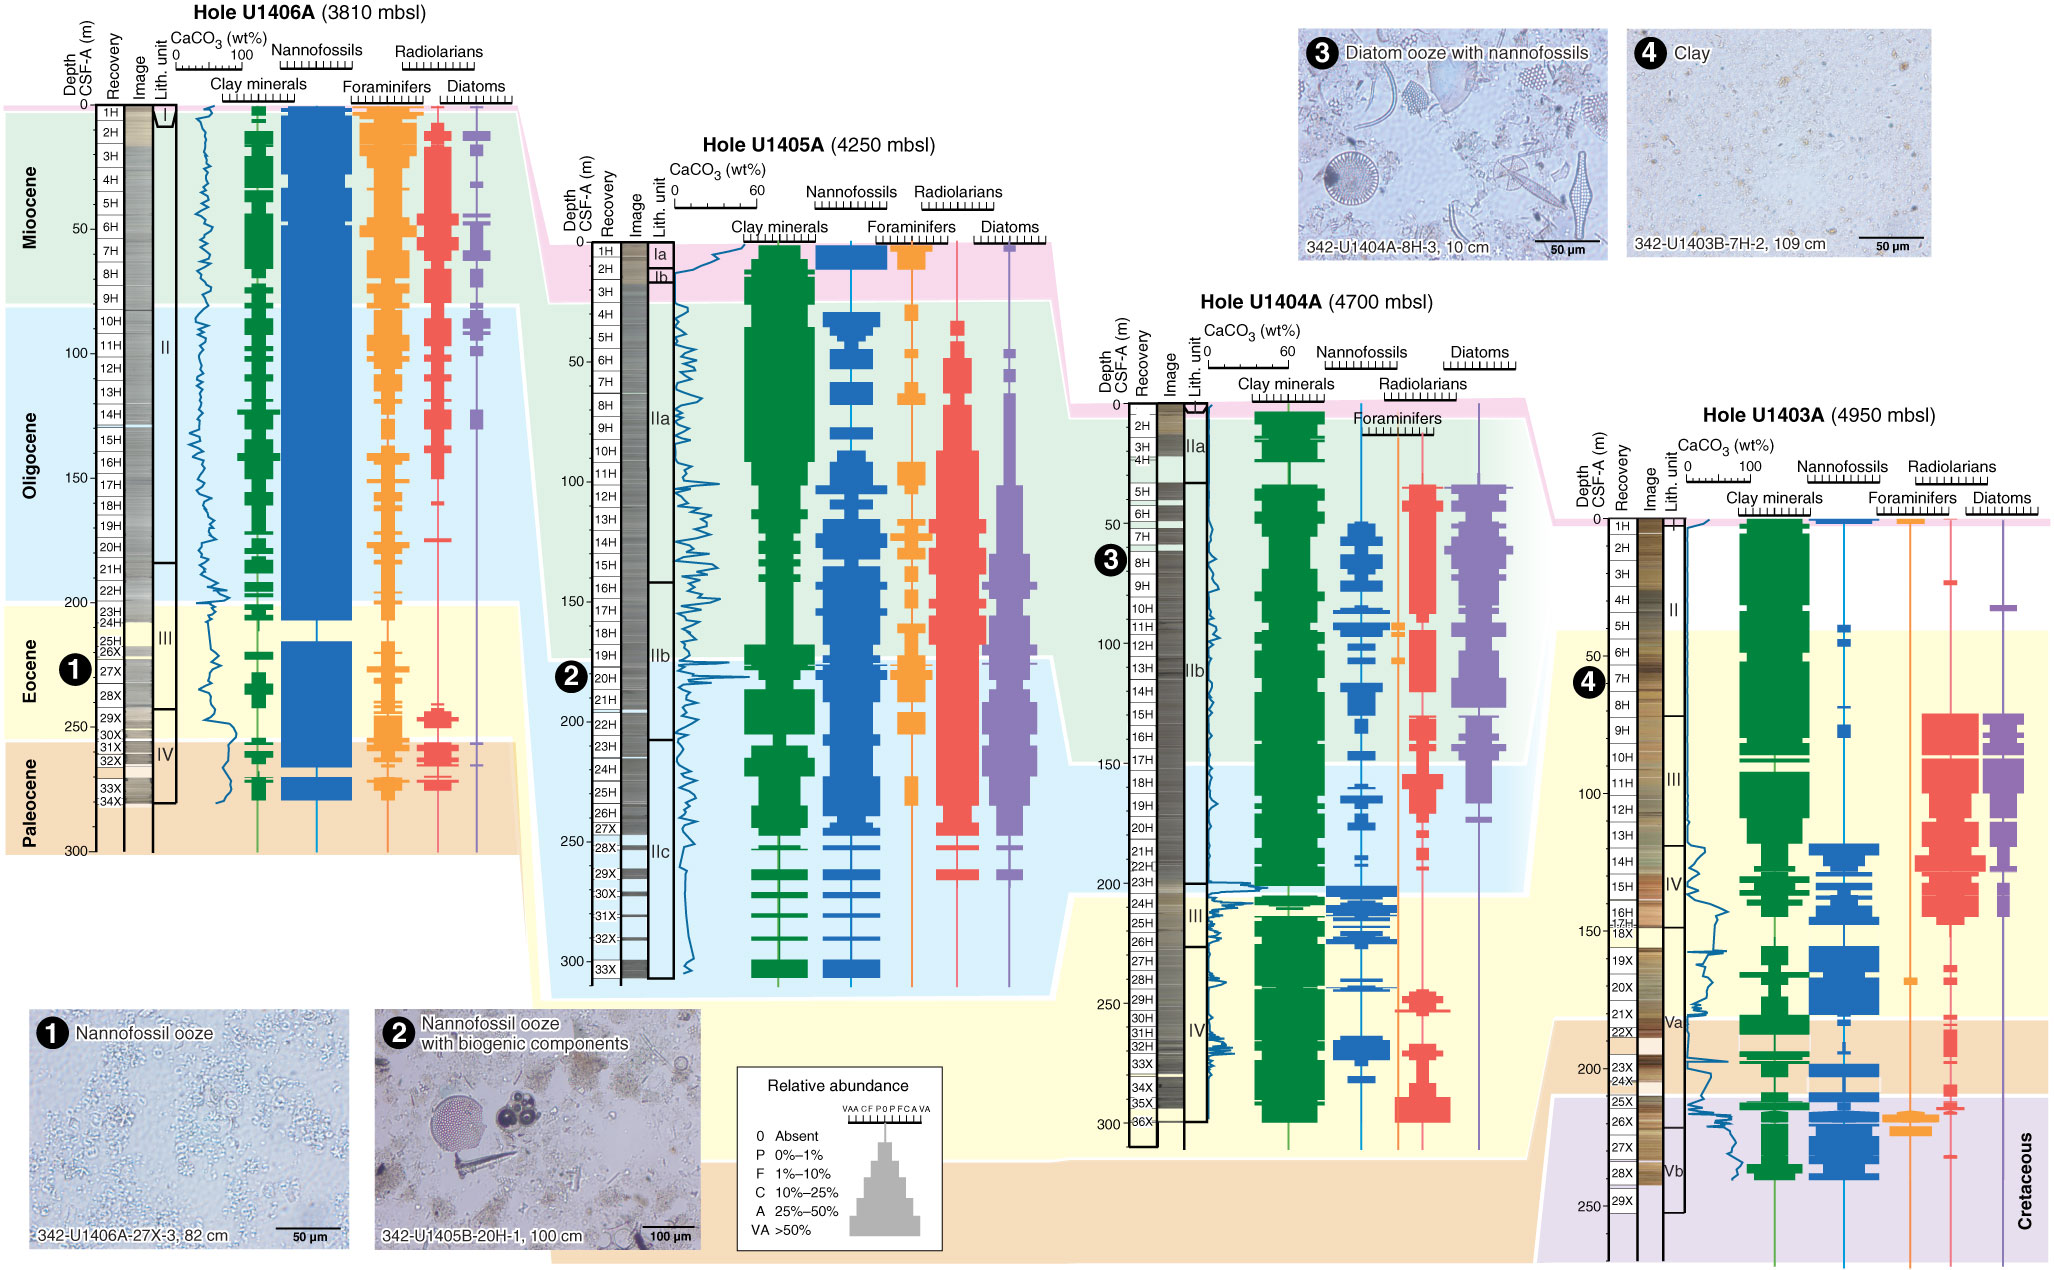
Figure F25. Smear slide results of major biotic lithologic components and their relative abundance by depth at J-Anomaly Ridge, Sites U1403–U1406. Photomicrographs of smear slides indicate the representative example of lithology at each site. Abundance: P = poor, F = few, C = common, A = abundant, VA = very abundant.
Previous | Close | Next | Top of page