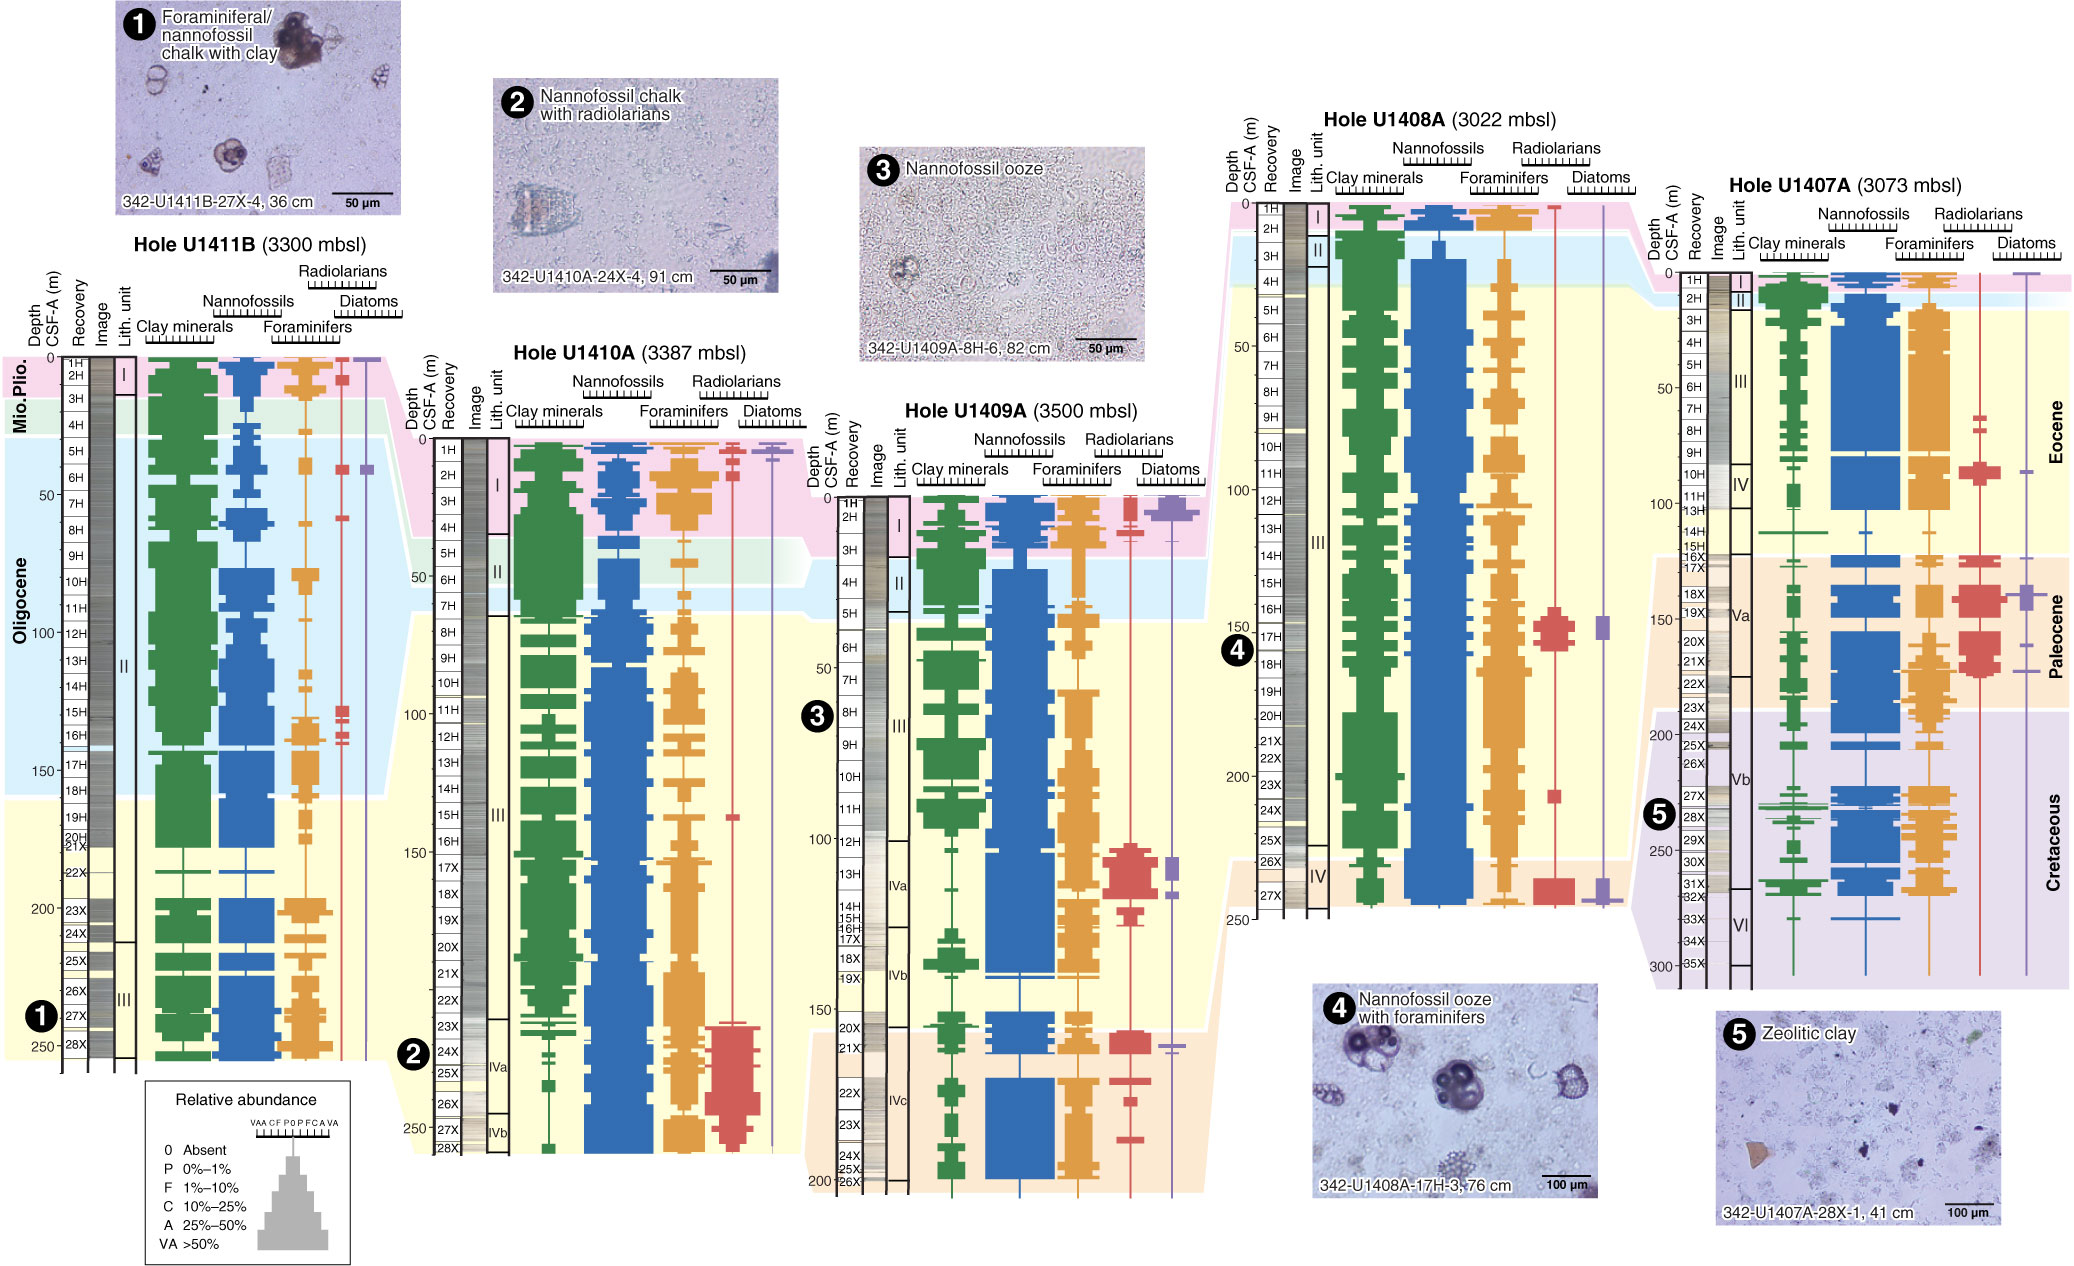
Figure F26. Smear slide results of major biotic lithologic components and their relative abundance by depth, Sites U1407–U1411. Photomicrographs of smear slides indicate the representative example of lithology at each site. Abundance: P = poor, F = few, C = common, A = abundant, VA = very abundant.
Previous | Close | Next | Top of page