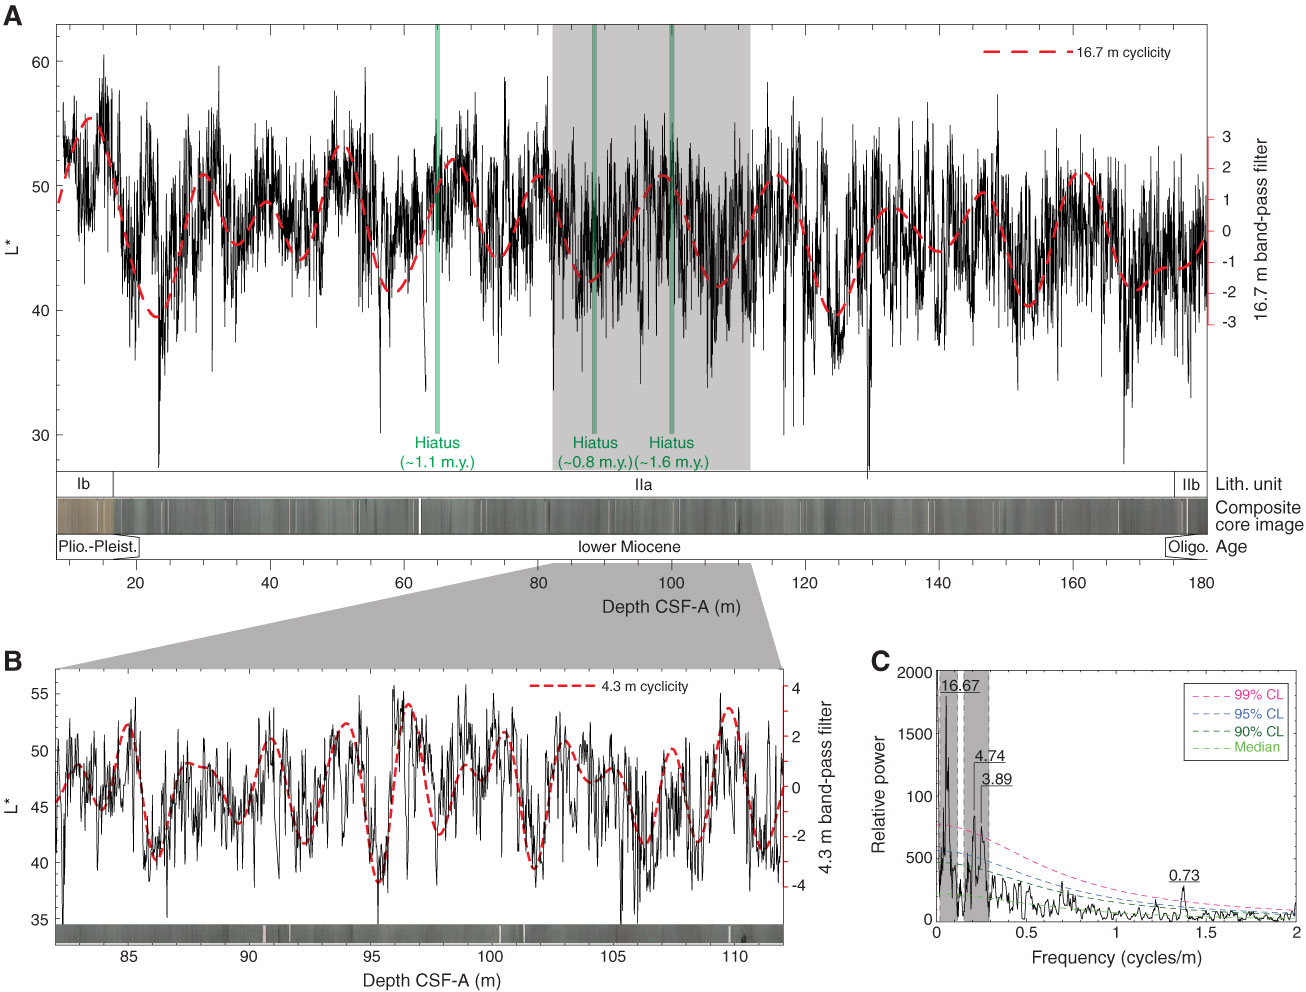
Figure F48. Plots of color reflectance (L*) variations, Hole U1405A. A. Band-pass gaussian filter output highlighting a 16.7 m cyclicity. B. Expanded view of shaded area in A with band-pass gaussian filter output highlighting a 4.3 m cyclicity. C. Power spectrum of A with red noise modeling. Only periods (in meters) of peaks exceeding 99% confidence level (CL) are shown. The two gray-shaded areas indicate frequency pass bands filtered to isolate the 16.7 and 4.3 m cyclicities shown in A and B, respectively. Note that only the low-frequency portion of the spectrum (0–2 cycles/m) is plotted to highlight the prominent 16.7 and 4.3 m cyclicities with the smaller 0.73 m cyclicity (see text for discussion).
Previous | Close | Next | Top of page