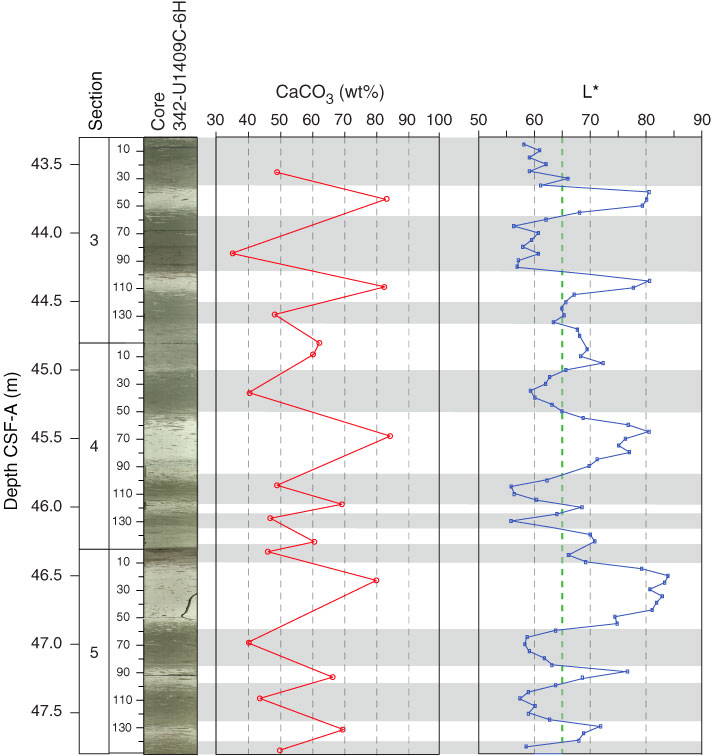
Figure F49. Plot of changes in carbonate content in alternating light greenish gray nannofossil clays and carbonate-rich white nannofossil ooze, Core U342-U1409C-6H. The low-resolution carbonate record mirrors the color reflectance (L*) curve, suggesting a strong cyclic signal.
Previous | Close | Next | Top of page