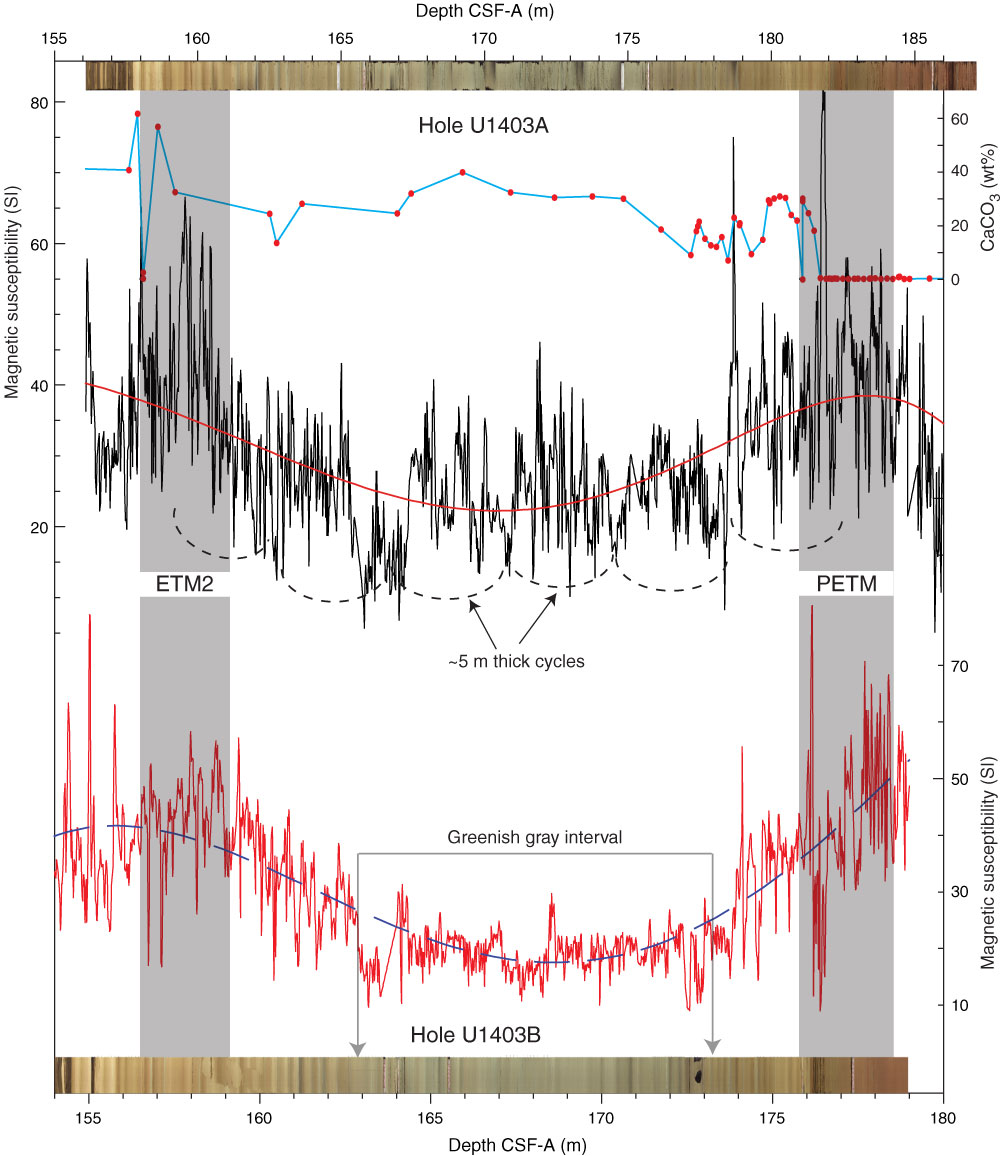
Figure F52. Plots of magnetic susceptibility and carbonate content variations spanning the Eocene Thermal Maximum 2 (ETM2) and the Paleocene/Eocene Thermal Maximum (PETM) hyperthermal events, Holes U1403A and U1403B. A fifth-order polynomial fit is shown to indicate a parabolic trend bounding the two events. A ~5 m cyclicity is also shown in Hole U1403A.
Previous | Close | Next | Top of page