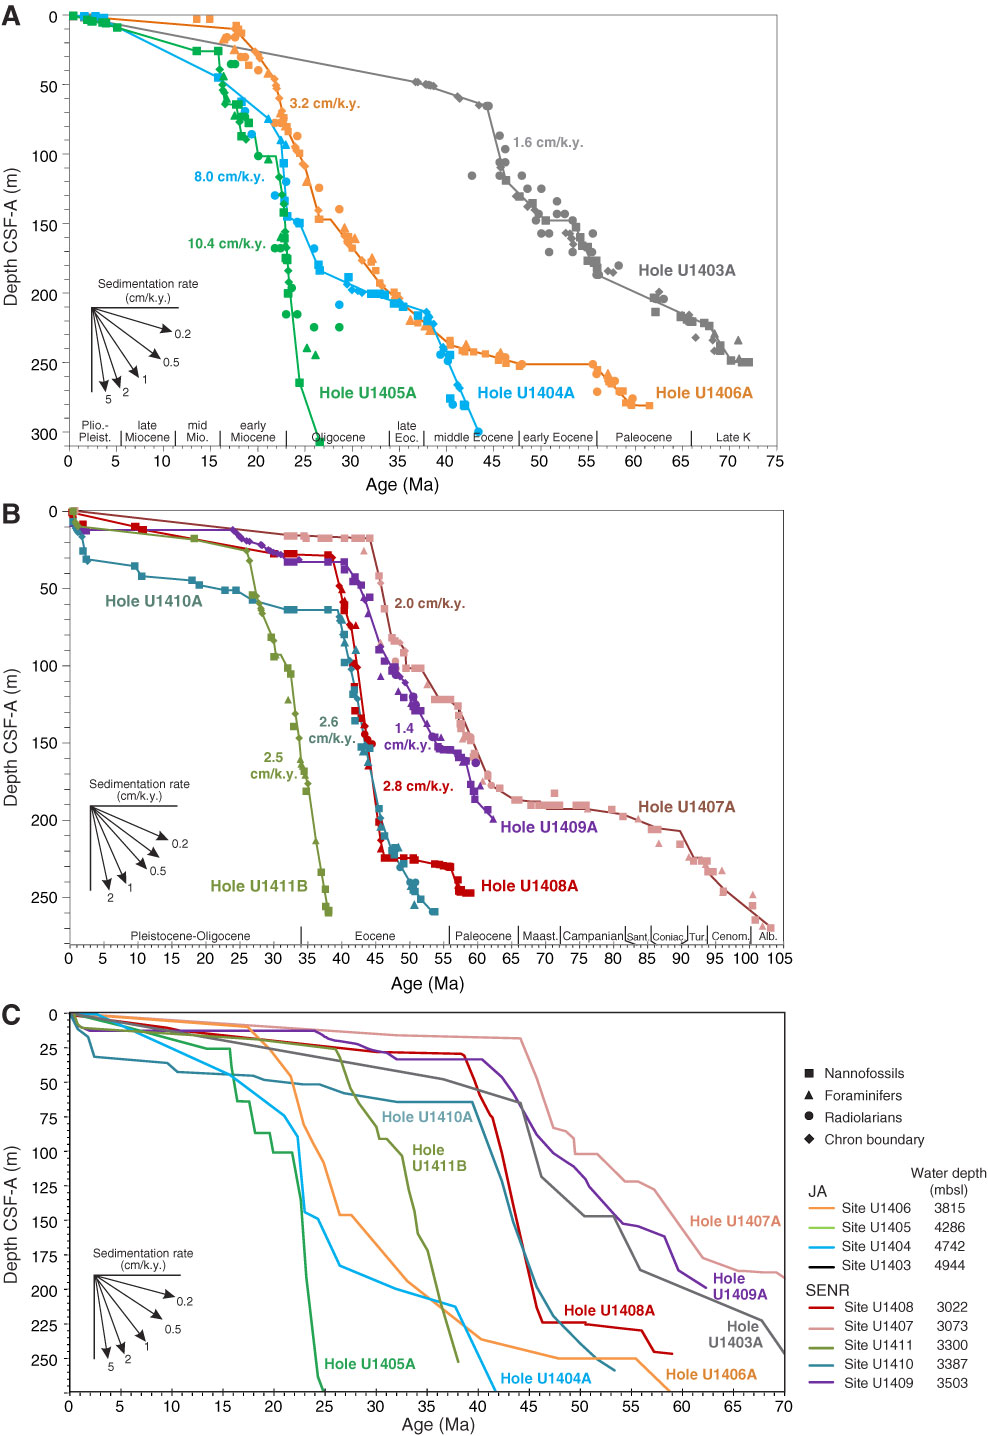
Figure F53. Plots of age-depth models, Sites U1403–U1411. A. Biostratigraphic and paleomagnetic datums and sedimentation rate curves for J-Anomaly Ridge Holes U1403A, U1404A, U1405A, and U1406A. B. Biostratigraphic and paleomagnetic datums and sedimentation rate curves for Southeast Newfoundland Ridge Holes U1407A, U1408A, U1409A, U1410A, and U1411A. C. Sedimentation rate curves for all sites. Maximum sedimentation rates are shown for each hole in A and B.

Previous | Close | Next | Top of page