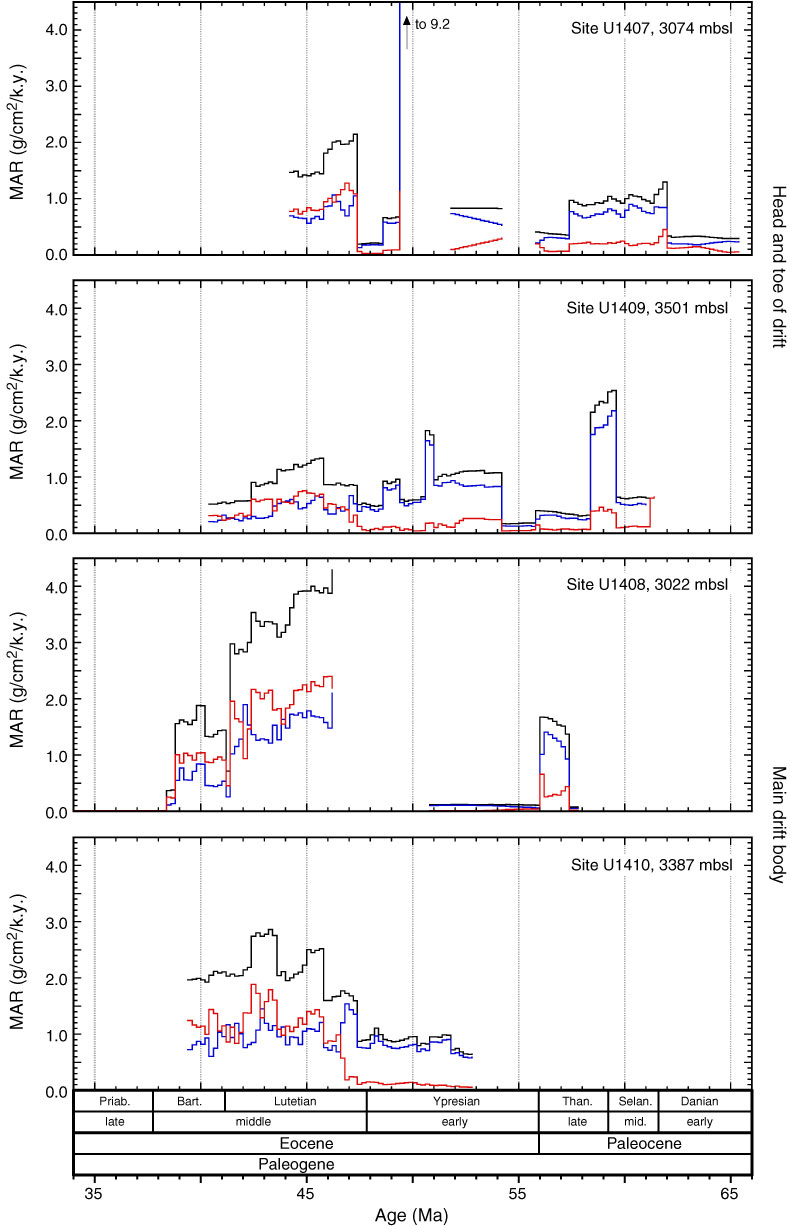
Figure F56. Plots of mass accumulation rate (MAR) for Paleocene–Eocene sequences on the edges of drifts on the Southeast Newfoundland Ridge, Sites U1407–U1410. Black lines = total MAR, blue lines = carbonate accumulation rates, red lines = noncarbonate accumulation rates.
Previous | Close | Next | Top of page