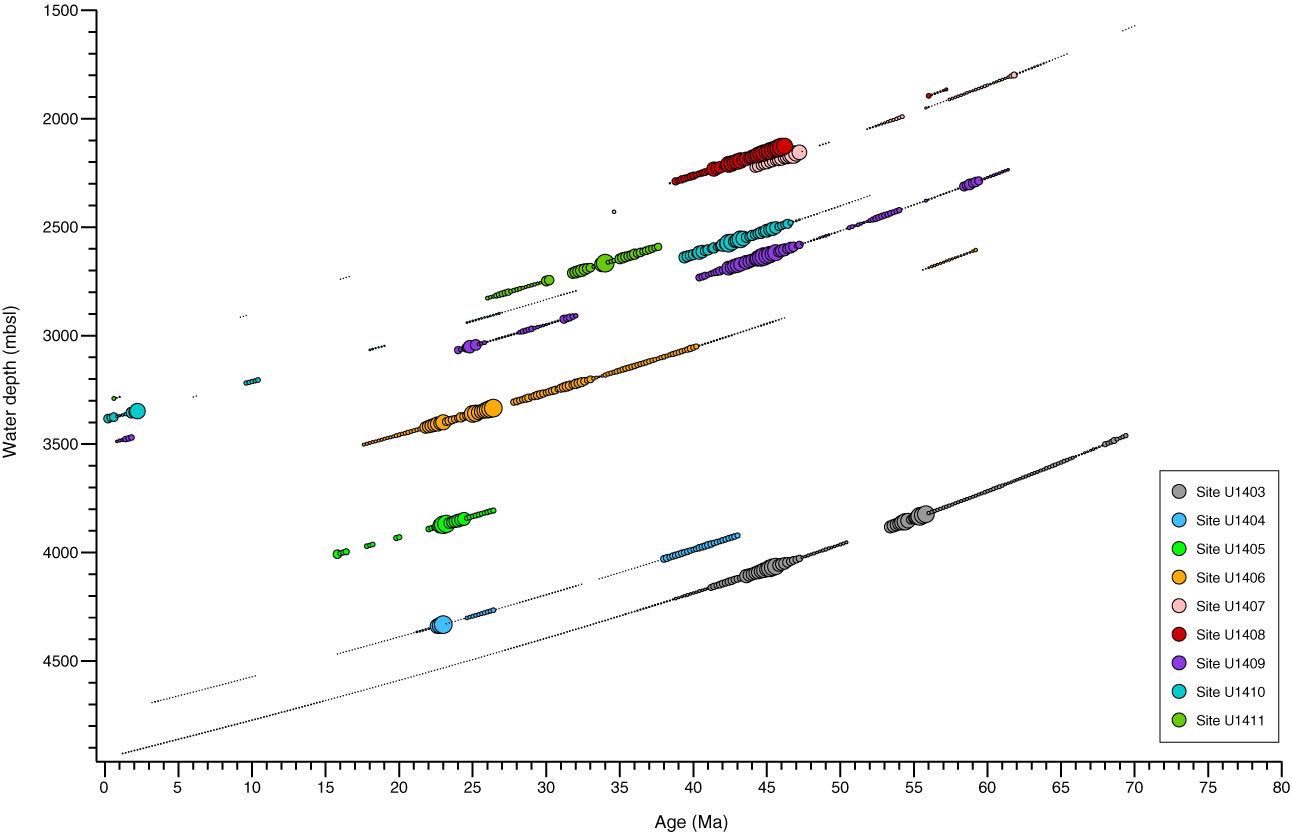
Figure F57. Plot of total mass accumulation rate (MAR) shown on lines of subsidence for each Expedition 342 site. The diameter of the circles indicates the relative MAR for a given time step, with larger circles corresponding to higher MAR. Very small circles indicate a sedimentary record, but MAR is very slow. Gaps in each subsidence line indicate the duration of hiatuses. The time step for each MAR record is the same as in Figures F54, F55, and F56.
Previous | Close | Next | Top of page