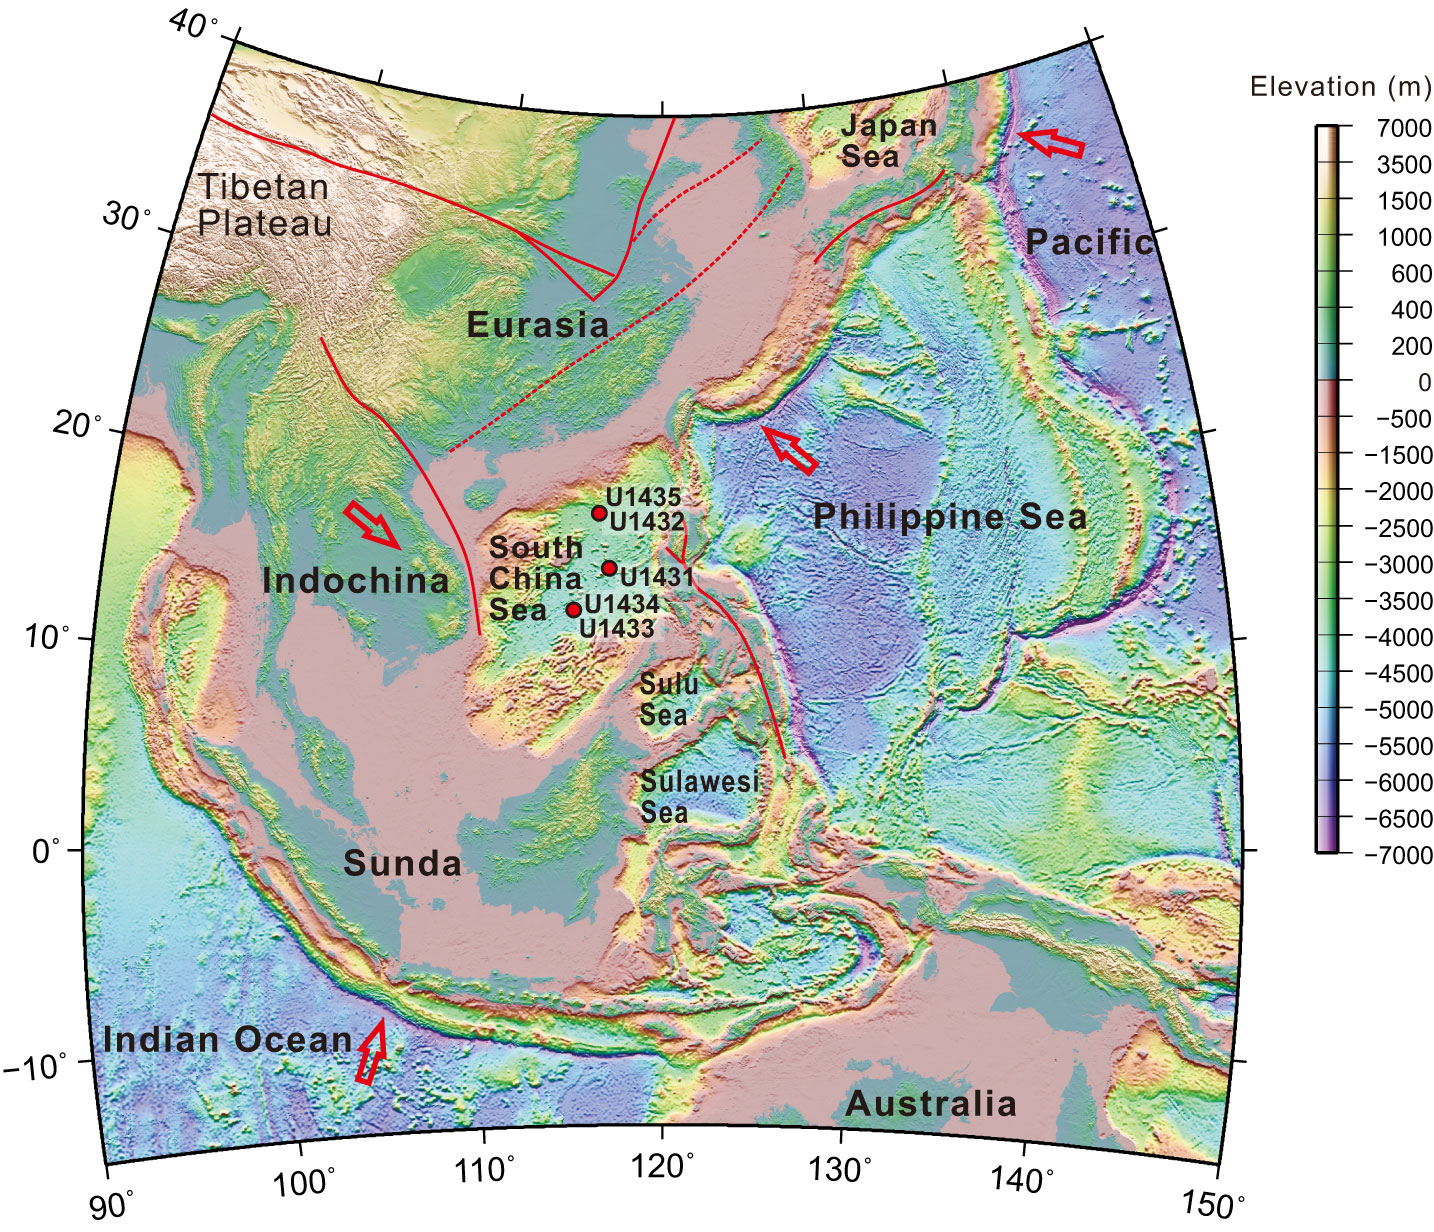
Figure F1. Regional topography and geodynamic framework of Southeast Asia. Data based on Smith and Sandwell (1997). Solid red lines = regional faults. Red arrows show direction of plate movement and solid red circles mark sites drilled during Expedition 349.
Close | Next | Top of page