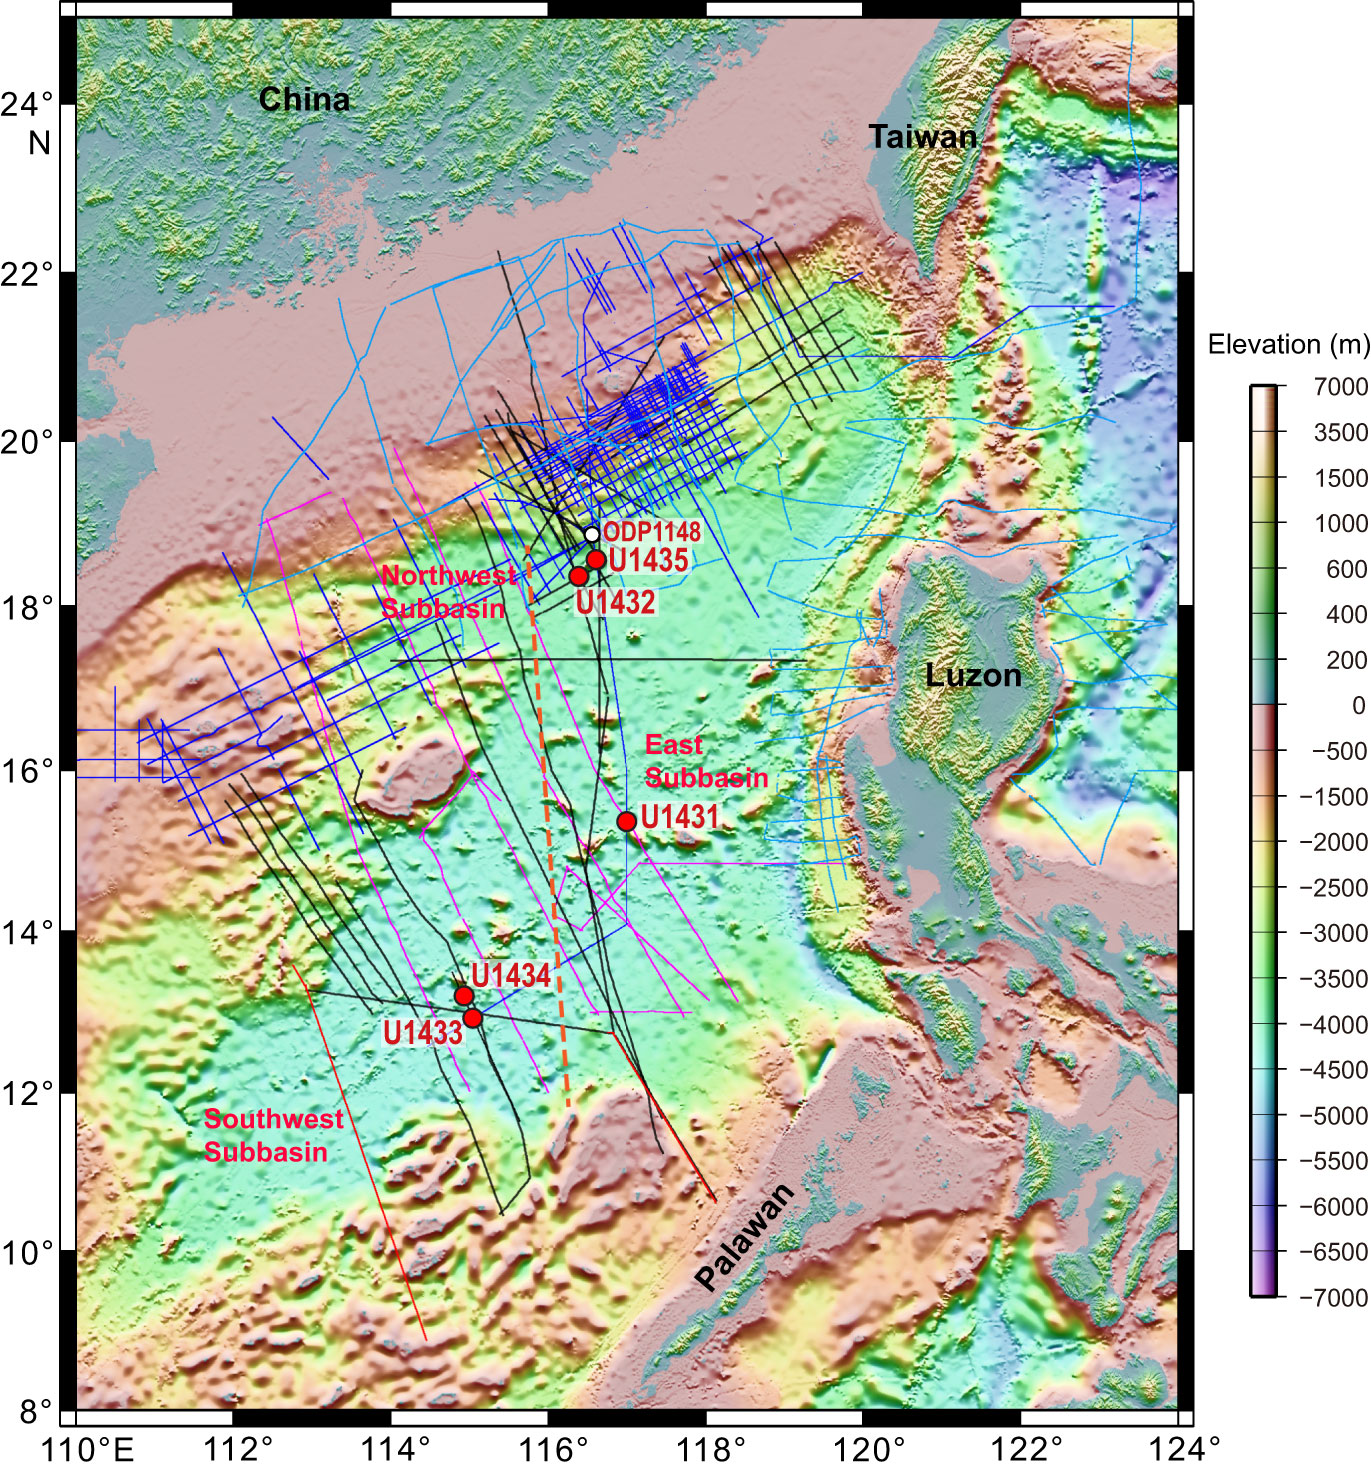
Figure F2. Topographic and bathymetric map of the South China Sea and surrounding region. Dashed red line = inferred Zhongnan fault. Solid red circles = sites drilled during Expedition 349. Solid white circle = location of Ocean Drilling Program (ODP) Site 1148. Pink lines = seismic surveys collected during Cruises SO49 (1987) and SO197 (2008) on the R/V Sonne. Blue, red, and black lines = seismic data collected by Chinese research institutes and oil companies. Turquoise lines = reflection seismic data acquired in the 1980s from Cruises V3607, V3608, V3613, V3614, and RC2006.
Previous | Close | Next | Top of page