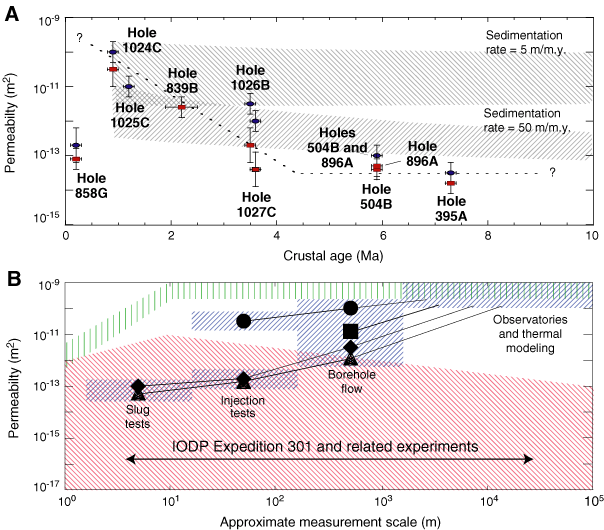
Figure F5. Permeability of upper oceanic crust versus crustal age and measurement scale prior to Expedition 301. A. Permeability versus crustal age. Squares (red) show packer measurements, circles (blue) show results from temperature log (flow meter) experiments. Bars indicate uncertainties in crustal age and estimated bulk permeability. Dashed line shows crude permeability-age trend, with a rapid reduction during the first 4 m.y., followed by a maintenance of bulk permeability of ~10–14 to 10–13 m2 (data compiled from these studies and sources cited therein: Fisher, 1998; Fisher and Becker, 2000; Becker and Davis, 2004). Additional data were collected in 165 Ma seafloor (Larson et al., 1993) but are not shown. Temperature data generally suggest permeabilities somewhat higher than those suggested by packer data. Shaded regions are results of calculations of permeability trends based on consideration of global heat flow data (Fisher and Becker, 2000). Borehole observations are consistent with global heat flow considerations until ~4 Ma, and then observations deviate from these predictions. This may occur because flow becomes more focused with age, as smaller pores fill. B. Permeability estimates from boreholes on the eastern flank of the Juan de Fuca Ridge, plotted as a function of measurement scale (solid symbols and blue shaded areas [Becker and Davis, 2003]). Other shaded areas indicate compilations for fractured crystalline rocks (red bands [Clauser, 1992]) and results from tests in fractured sedimentary rocks (green bands [Rovey and Cherkauer, 1995; Schulze-Makuch and Cherkauer, 1997]). Expedition 301 and related experiments will help to elucidate the scaling of crustal permeability over the range indicated with the double-headed arrow, as discussed in the text and in later figures.
