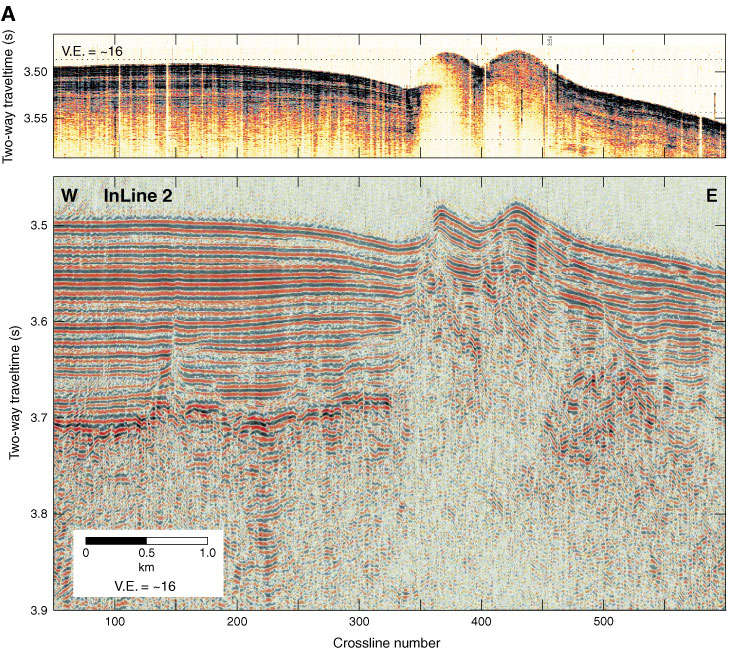
Figure F10. Example seismic lines. MCS and Parasound data, from the 2000 ImageFlux expedition across First Ridge area. Line locations are shown in Figures F4 and F9. VE = vertical exaggeration. A. InLine 2. (Continued on next five pages.)
Previous | Close | Next | Top of page