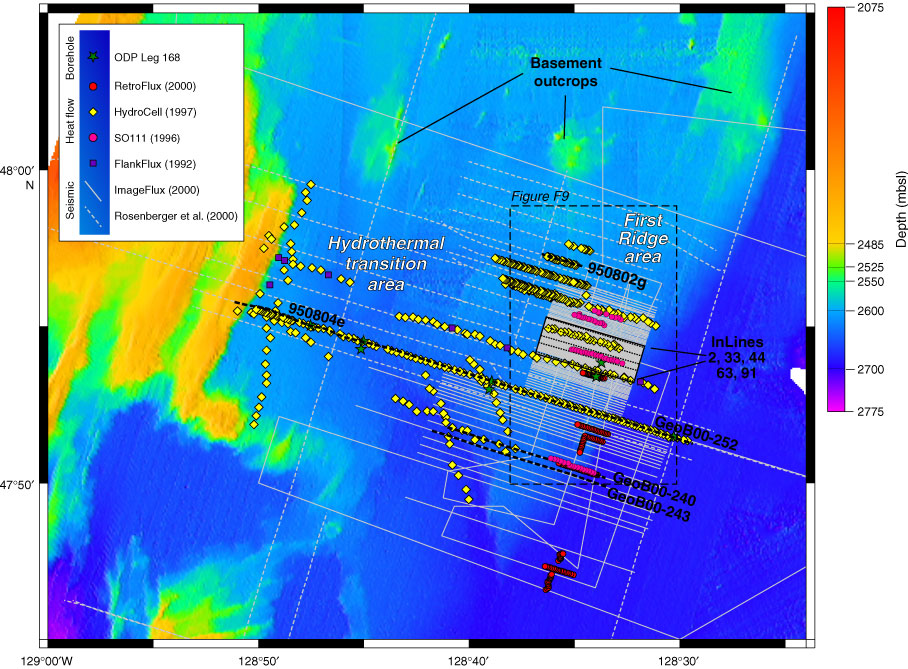
Figure F4. Swath map of the hydrothermal transition and First Ridge areas, showing distribution of heat flow data and selected track lines. Detailed track chart for First Ridge area shown in Fig. F9 (see "Supplementary Material" for the high-resolution version of this figure in its native format).