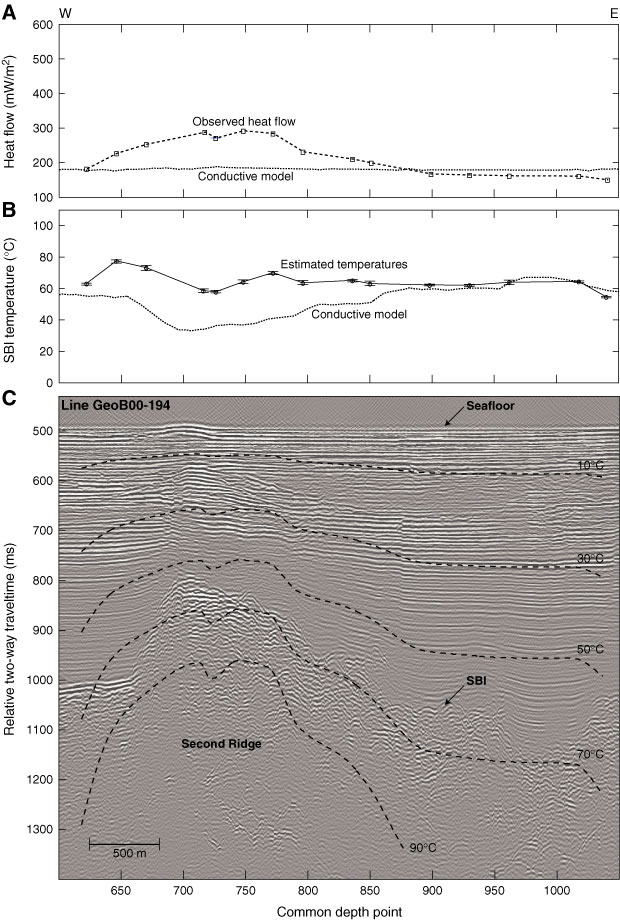
Figure F16. Seismic, heat flow, and calculated sediment/basement interface (SBI) temperatures around and across the Second Ridge along seismic Line GeoB00-194, ~4.5 km south of Baby Bare outcrop (line location in Fig. F3). A. Measured seafloor heat flow (open squares), with uncertainties in measured values being smaller than the symbols. Dotted line is output of two dimensional conductive model, using lithospheric cooling curve as lower thermal boundary condition. B. Calculated SBI temperatures (circles) based on heat flow and seismic data and output of two-dimensional conductive model (dotted line). Uncertainties in upper basement temperatures are indicated by vertical bars, based on the accumulation of errors through downward-continuation calculations, as described in the text. C. Seismic data overlain by isotherms calculated from measured seafloor heat flow. Vertical exaggeration = ~5.
Previous | Close | Next | Top of page