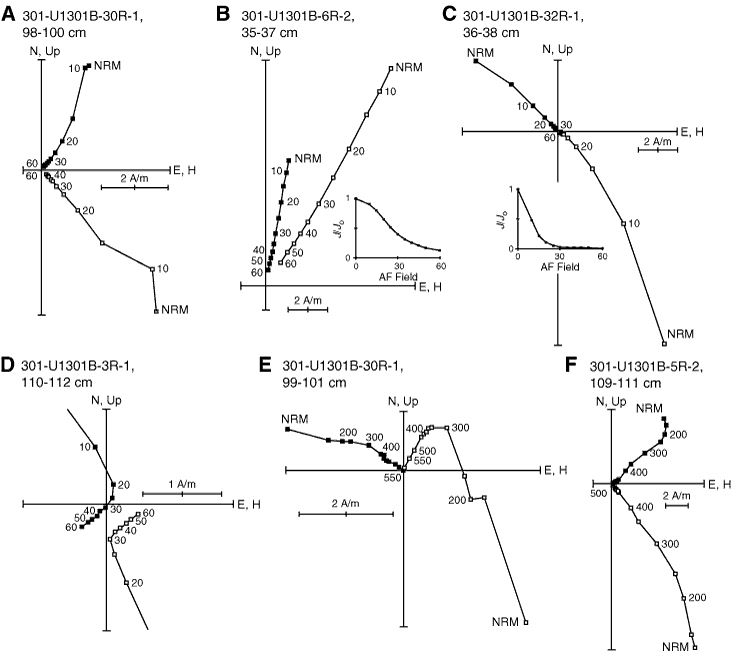
Figure F44. Orthogonal vector plots of selected igneous rock samples from Hole U1301B. Points represent successive vector endpoints during progressive, stepwise alternating field (AF) and thermal demagnetization. Small numbers give the field strength for AF demagnetization (in mT; A–D) or the temperature for thermal demagnetization (in °C; E, F). A. AF demagnetization showing simple univectorial decay toward the plot origin. Note that the natural remanent magnetization (NRM) shows a steep, downward-directed overprint. B. AF demagnetization showing univectorial decay from a sample with a high coercivity. Note there is no apparent NRM overprint. Inset shows reduction of magnetization strength with increasing field. C. AF demagnetization of a sample with low coercivity. Note the rapid reduction of magnetization within first several AF steps. Inset shows the reduction in magnetization intensity with increasing AF field strength, for comparison with B. D. Enlargement of orthogonal vector plot for a sample with a high-coercivity component that causes the demagnetization path to veer away from the origin of the plot. E, F. Thermal demagetization of two samples showing eventual univectorial decay toward plot origin. Both samples display a downward overprint on the NRM. The sample in E shows a reversal of magnetization sign with the characteristic remanent magnetization having a negative sign. Interestingly, this sample is from the same piece as the AF demagnetized sample in A, which has a different characteristic magnetization sign. The reason for this difference is not known.

Previous | Close | Next | Top of page