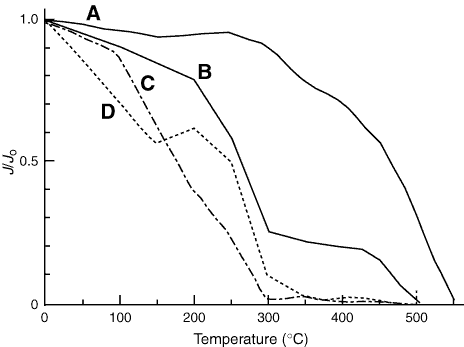
Figure F45. Plot showing the reduction of magnetization intensity of four samples during thermal demagnetization, each sample having a different behavior. A. Sample 301-U1301B-34R-2, 26–28 cm, maintains high magnetization strength until high temperature, at which point the magnetization falls off rapidly with increasing temperature. B. Sample 301-U1301B-20R-1, 47–49 cm, shows two magnetization plateaus, one at low temperature and one a higher temperature. C. Sample 301-U1301B-4R-4, 45–47 cm, displays significant demagnetization at low temperature. D. Sample 301-U1301B-30R-1, 63–65 cm, shows an increase in magnetization between 200° and 250°C, probably indicative of the presence of the magnetic mineral pyrrhotite.

Previous | Close | Next | Top of page