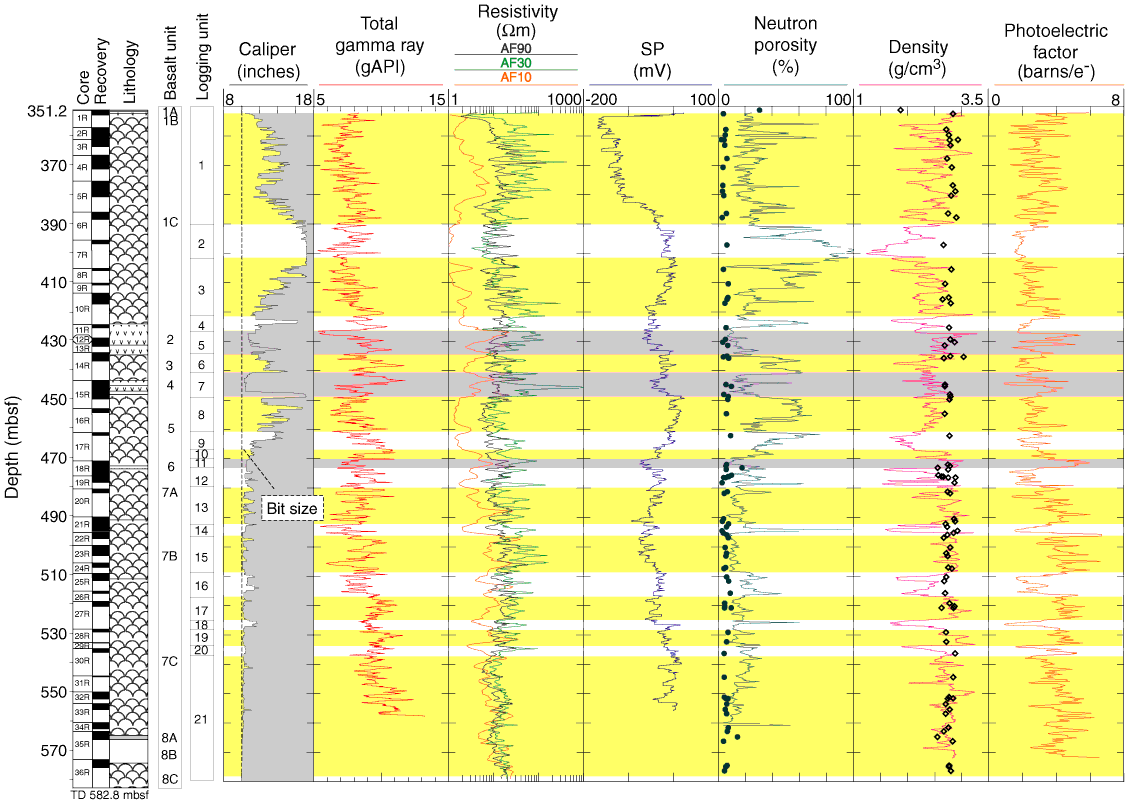
Figure F74. Results of triple combo tool string measurements from Hole U1301B. The left panels show the core reference with core recovery and principal lithologic units as derived from core descriptions. For electrical resistivity measurements, only curves of 4 ft vertical resolution with different penetration (AF10 = 10 inches and AF90 = 90 inches penetration) are shown. Dots and diamonds in the neutron porosity and density panels represent shipboard measurements on core samples. Logging units are represented by white, yellow, and purple shading: yellow = more massive intervals, white = mostly fractured intervals, and purple shading = position of massive basalts of Units 2, 4, and 6. SP = spontaneous potential. Legend for lithology can be found in "Lithostratigraphy."

Previous | Close | Next | Top of page