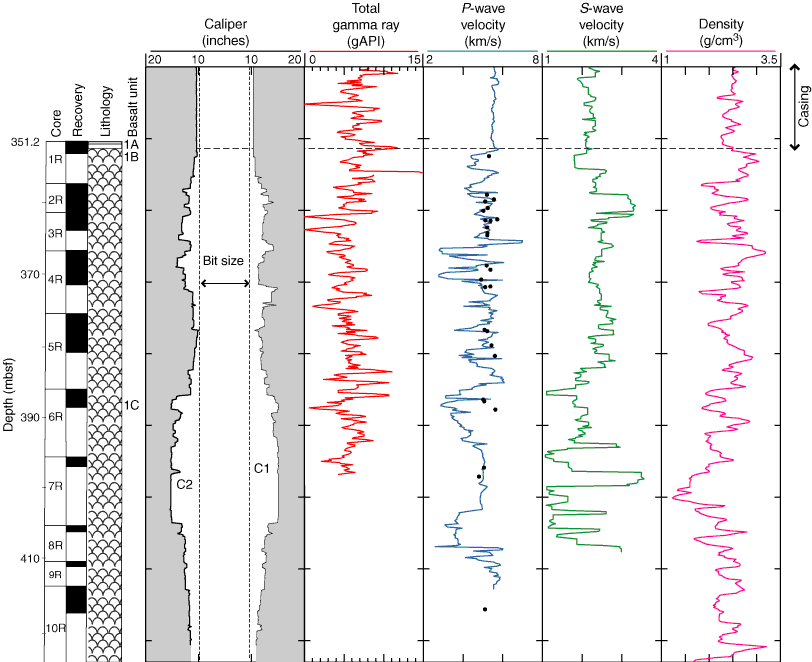
Figure F75. Results from the FMS-sonic tool string measurements in Hole U1301B. The left panels show the core reference with core recovery and principal lithologic units as defined from core descriptions. Data are from the first FMS-sonic tool string pass. Black dots in the P-wave velocity panel represent discrete measurements on core samples. The right panel shows the density log from the triple combo for comparison.

Previous | Close | Next | Top of page