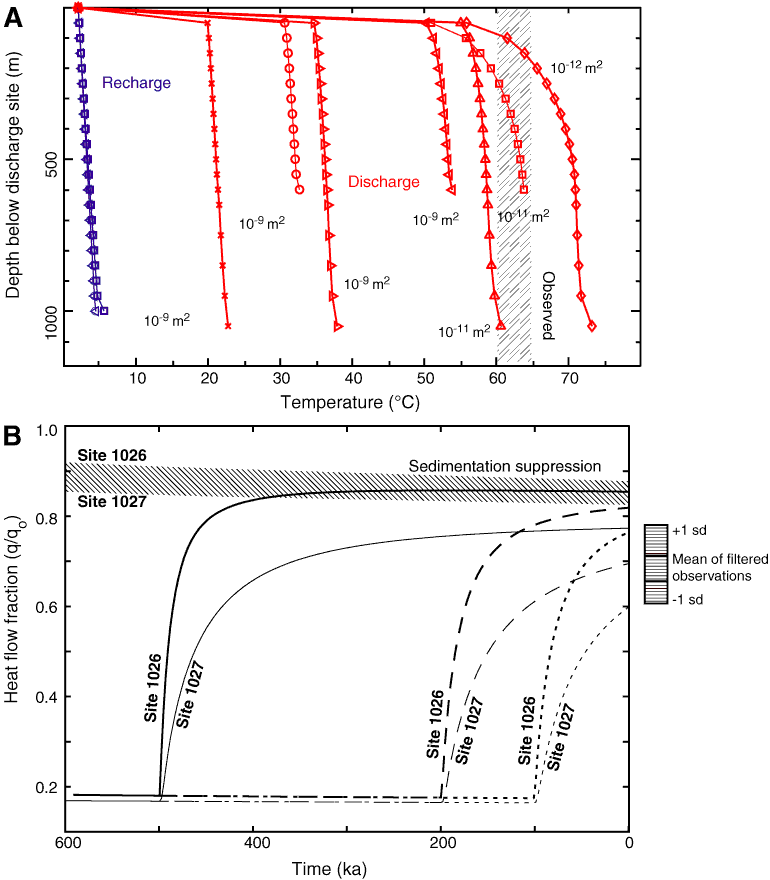
Figure F2. Selected results of thermal and fluid flow models in the Expedition 301 field area. A. Basement recharge and discharge temperatures from transient, two-dimensional, self-sustaining, outcrop to outcrop models of coupled fluid and heat flow (Hutnak et al., 2006). Blue = temperatures within recharge areas, red = temperatures within discharge areas. Curves extend to different depths depending on the thickness of the basement aquifer. Vertical band = observed and inferred regional basement temperature range (60°–65°C) consistent with the chemistry of upper crustal fluids. Modeled upper basement temperatures are excessively cooled when basement permeability exceeds 10–11 m2. Permeability ≤10–12 m2 allows basement to become too warm, and eventually prevents formation of a hydrothermal siphon. Three-dimensional simulations would likely shift these curves somewhat to the right (Hutnak et al., 2006). B. Calculated seafloor heat flow fraction vs. time for ODP Sites 1026 (thick curves) and 1027 (thin curves), assuming an initial 80% efficiency in regional advective extraction of lithospheric heat by hydrothermal circulation, followed by cessation at 0.5 (solid lines), 0.2 (dashed lines), and 0.1 Ma (dotted lines) (modified from Hutnak and Fisher, 2007). Stippled band = magnitude of likely sedimentation corrections appropriate for these sites based on the known sedimentation history. Striped box = mean and ±1 standard deviation (sd) of filtered seafloor heat flow observations from 3.4 to 3.6 Ma seafloor extending 50 km north and south of the Expedition 301 field area (Hutnak et al., 2006).

Previous | Close | Next | Top of page