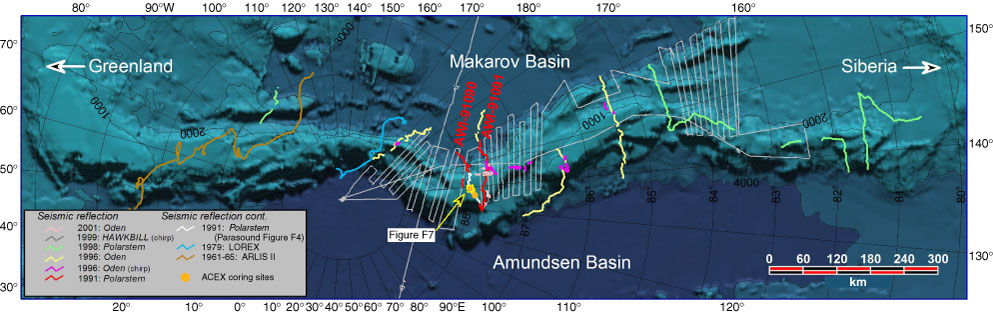
Figure F1. Map showing the accumulated geophysical database covering the Lomonosov Ridge. Bathymetry is from the International Bathymetric Chart of the Arctic Ocean (Jakobsson et al., 2000). A local track chart near Expedition 302 Sites M0001–M0003 is shown in Figure F7. The limit of this track chart is indicated by a yellow box.
Close | Next | Top of page