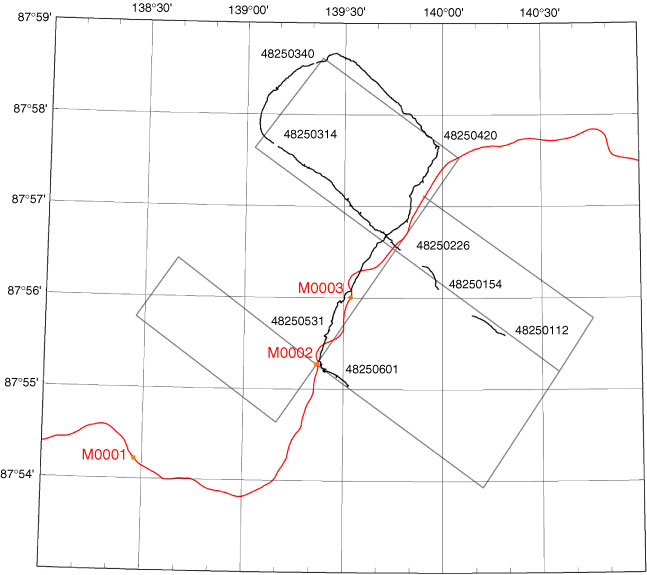
Figure F7. Track chart showing the planned (grey straight line) and surveyed (black “wiggly” line) seismic reflection profiling during the Expedition 302 cruise. The red line shows seismic reflection profile AWI-91090 (Jokat et al., 1992, 1995). Dark and light blue lines indicate profiles shown in Figure F10. The outline of the track chart is shown in Figure F1 (yellow box). GIS = geographic information system.
Previous | Close | Next | Top of page