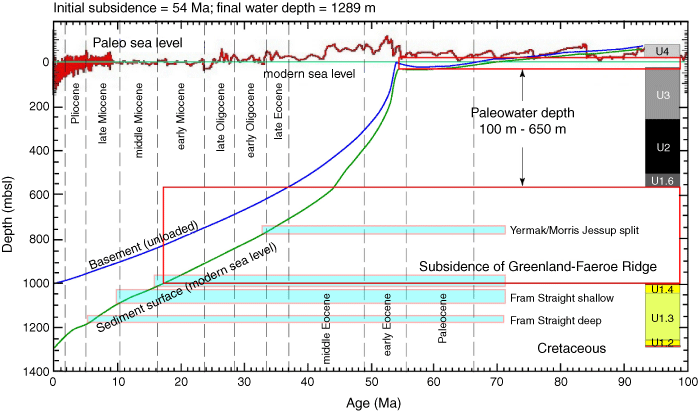
Figure F2. Modeled subsidence of the Lomonosov Ridge assuming simple postrifting (post 54 Ma) thermal subsidence to modern water depths. The upper (red) subsidence curve shows the subsidence of the ridge without a sediment loading correction. The lower (green) curve shows the subsidence of the sediment surface through time using an Airy correction for sediment loading. Subsidence is calculated relative to present-day sea level; however, an estimate of paleosea level (Miller et al., 2005) is shown at the top of the plot. No correction has been applied to account for variation in loading resulting from variation in sea level. The column at the right of the figure depicts the lithostratigraphic units recovered from the Lomonosov Ridge plotted relative to their age-depth position on the lower subsidence curve.

Previous | Close | Top of page