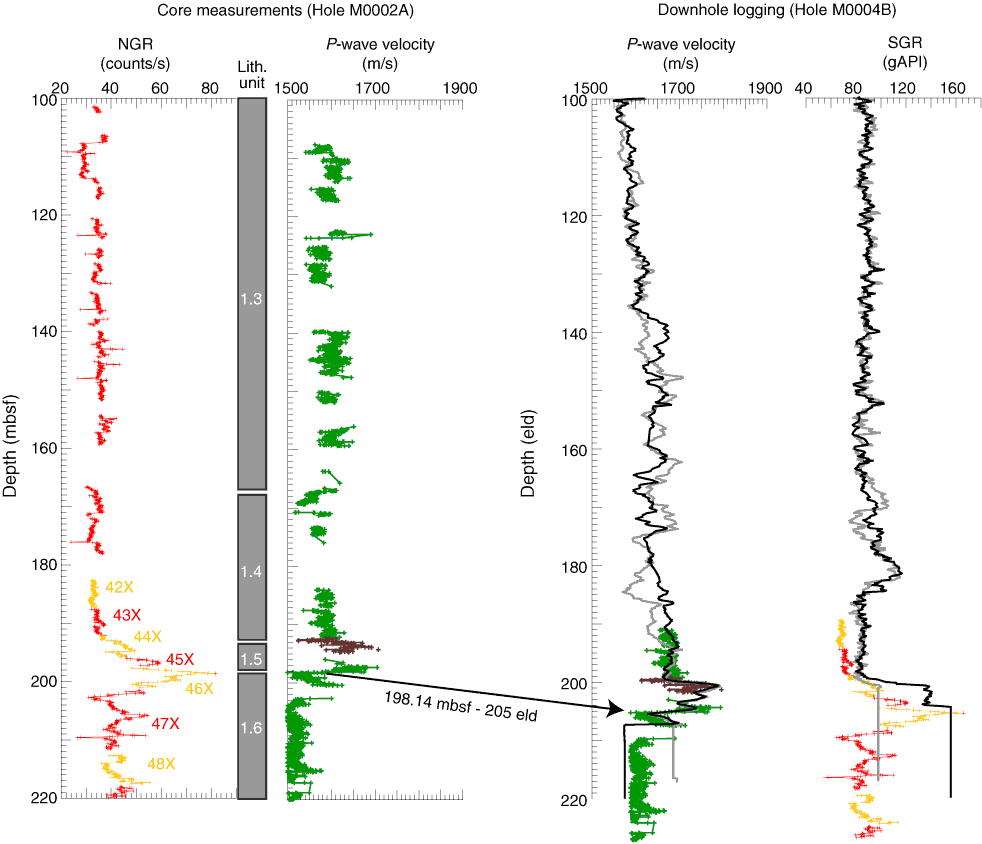
Figure F3. Core and logging measurements of P-wave velocity and natural gamma radiation (NGR) showing likely tie for the base of lithologic Subunit 1.5. eld = equivalent logging depth. P-wave velocity measured shipboard on whole cores except the “brown” colored measurements acquired on split cores during the sampling party in Bremen. Core measurements in vicinity of the proposed tie are superimposed on the logging data to highlight the fit. Black lines = pass 1 logging data, gray lines = pass 2 logging data.

Previous | Close | Next | Top of page