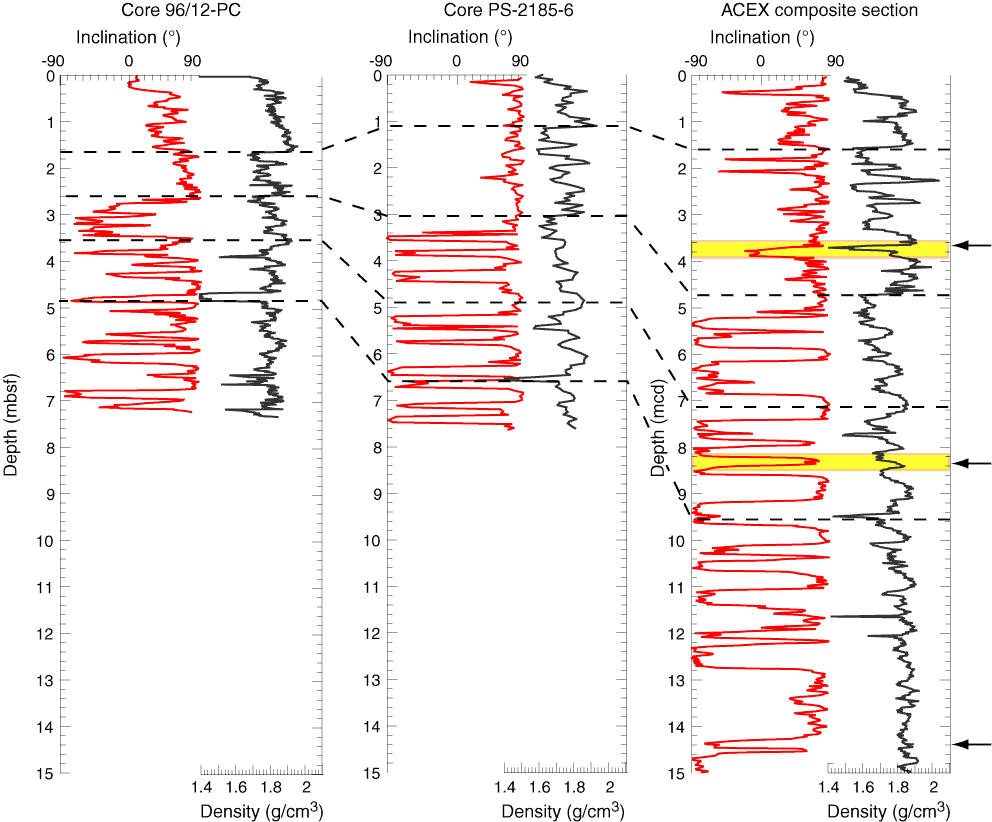
Figure F4. Paleomagnetic inclination and bulk density records from the ACEX composite section and Cores 96/12-1PC and PS-2185-6. ACEX data displayed using the offsets and tie points obtained from expedition results (see Tables T25 and T26 in the “Sites M0001–M0004” chapter). Arrows = position of tie points. Yellow boxes = regions where ACEX composite record deviates from stratigraphic successions recovered in neighboring cores. Dotted lines = similar sequences between the records.

Previous | Close | Next | Top of page