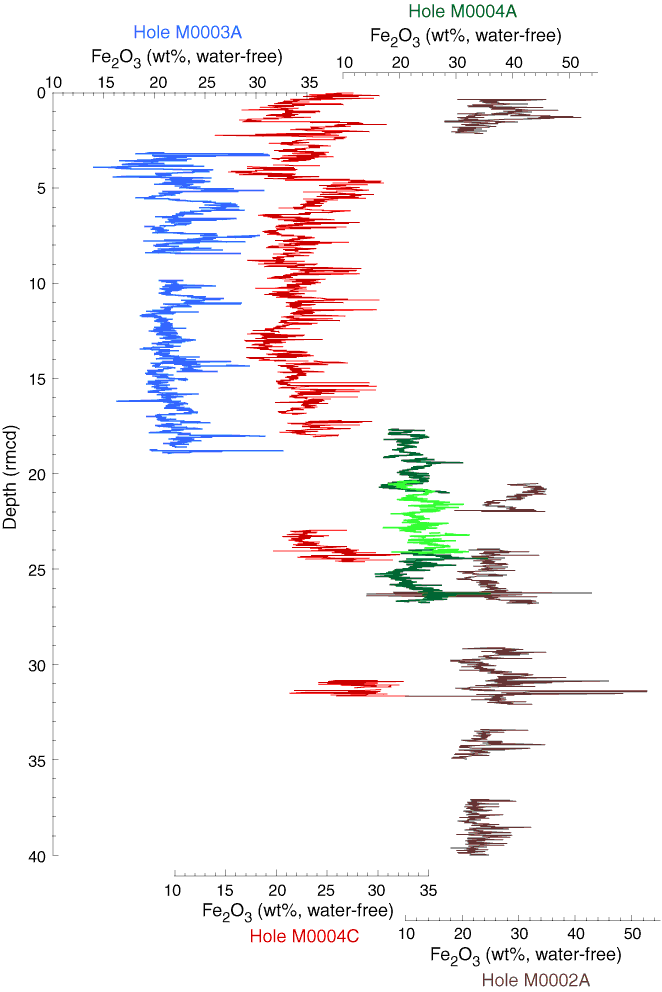
Figure F9. Fe2O3 concentrations in the uppermost 40 rmcd measured on U-channel samples using a nondestructive X-ray fluorescence scanner (TATSCAN-F2, IFREE/JAMSTEC) (Sakamoto et al., 2006) illustrating alignment of features between Holes M0002A, M0003A, M0004A and M0004C. Light green coloring applied to Core 302-M0004A-2X illustrates overlap with Cores 1H and 3X.

Previous | Close | Next | Top of page