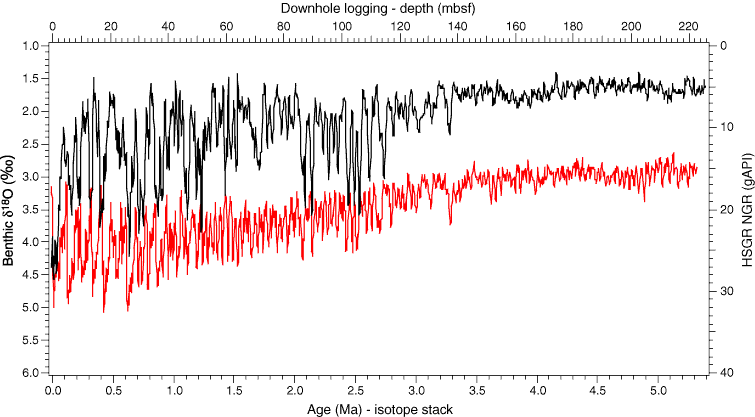
Figure F42. Linear correlation of logging natural gamma radiation (NGR; total spectral gamma ray [HSGR]; black) in Hole U1313B and benthic oxygen isotope stack (red) over last 5.4 m.y. (Lisiecki and Raymo, 2005). Both data sets are shown with scales inverted so that warm interglacials/low gamma ray (i.e., low Th = low clay) intervals are shown as prominent peaks. The correlation has only two tie points at 0 and 5.4 Ma with no stretching or squeezing of logging data depths.

Previous | Close | Next | Top of page