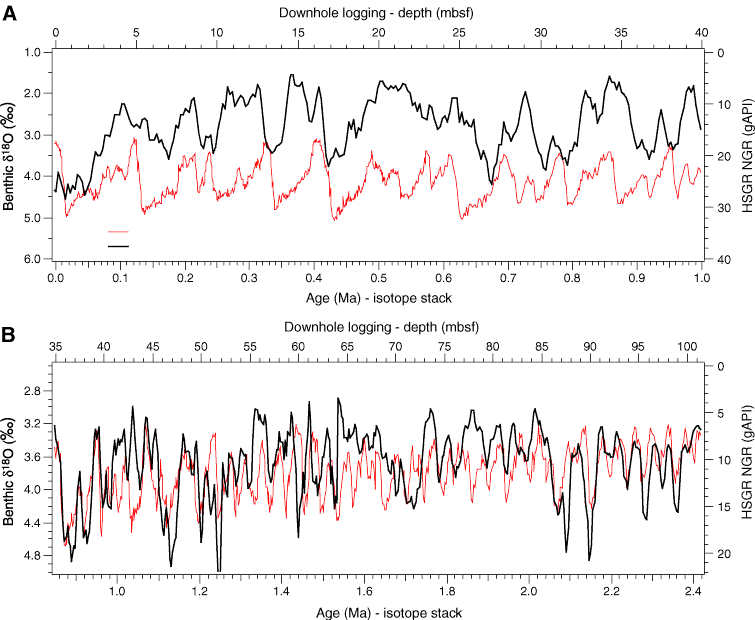
Figure F43. Expanded linear correlation shown in Figure F42 of logging gamma radiation (black) and benthic oxygen isotope stack (red) in Hole U1313B at four intervals. Vertical scales of both isotopes and gamma radiation are adjusted for plotting purposes for a given interval as necessary. Note the fidelity in detail of gamma ray record regardless of signal amplitude over almost the entire 5.4 m.y. record of oxygen isotopes. A. 0–1 Ma. B. 0.85–2.4 Ma. (Continued on next page.)

Previous | Close | Next | Top of page