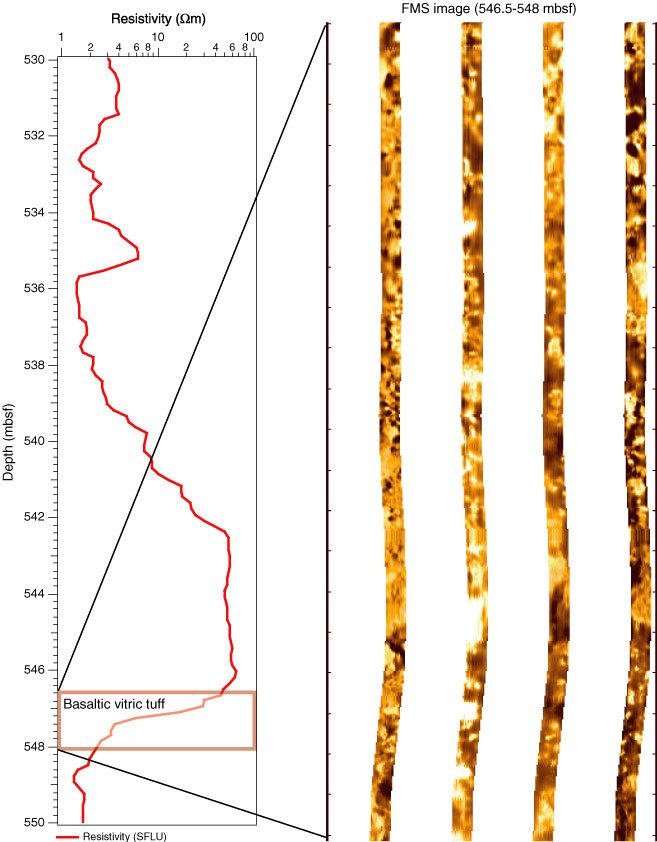
Figure F8. Detailed resistivity profile of Hole 642E showing a pattern of basalt flows with lower resistivity at the top and increasing toward the bottom. An enlarged portion of a Formation MicroScanner (FMS) image showing volcaniclastic (basaltic vitric tuff) interval beneath one flow and at the top of the next between 546 and 548 mbsf. SFLU = spherically focused resistivity.
Previous | Close | Next | Top of page