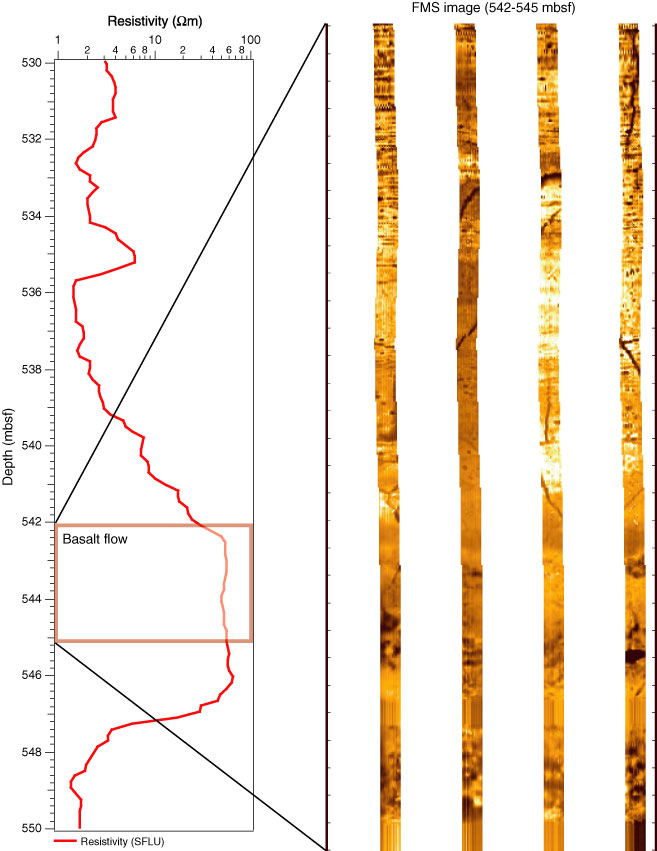
Figure F9. Detailed resistivity profile of Hole 642E showing the pattern of basalt flows with a lower resistivity at the top and increasing towards the bottom. A blowup of a Formation MicroScanner (FMS) image showing fine-grained basalt interval between 542 and 545 mbsf. SFLU = spherically focused resistivity.
Previous | Close | Next | Top of page