Previous | Close | Next
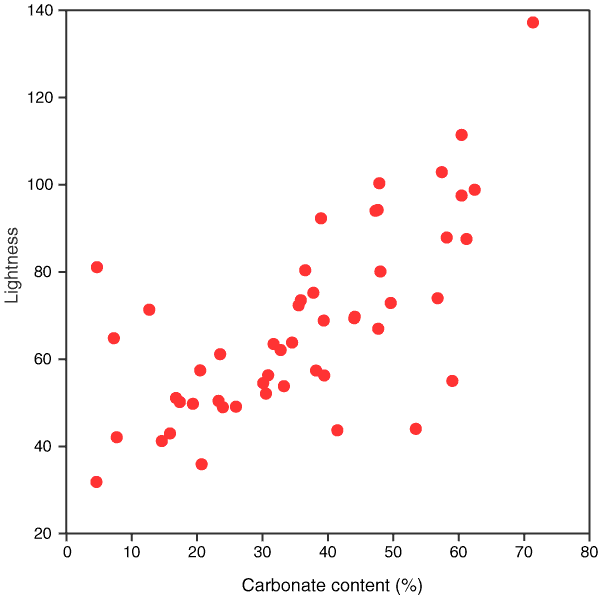
Figure F6. Cross-plot of lightness and carbonate data displayed vs. depth in Figure F5.
Previous | Close | Next | Top of page