Previous | Close | Next
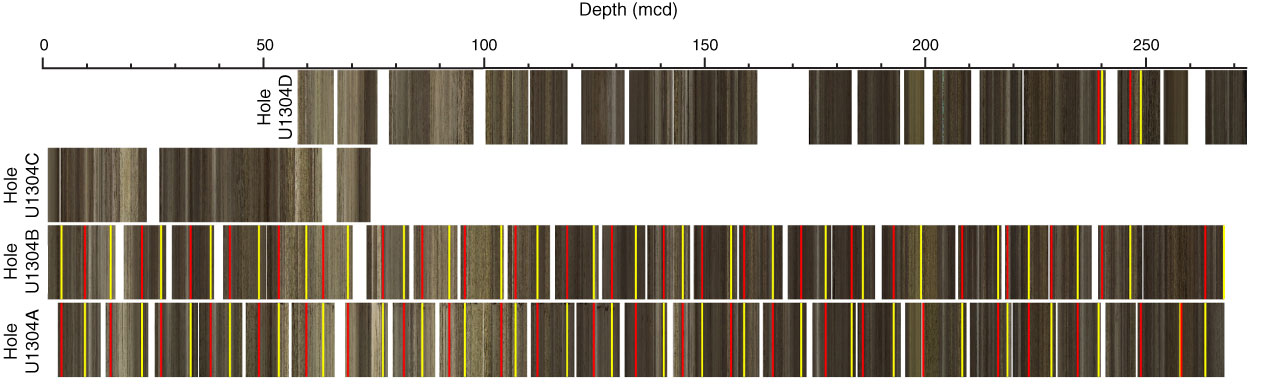
Figure F7. Site U1304 compound core images plotted vs. meters composite depth (mcd). Red bars = top of an interval used in composite depth scale, yellow = bottom of composite depth section.
Previous | Close | Next | Top of page