Previous | Close | Next
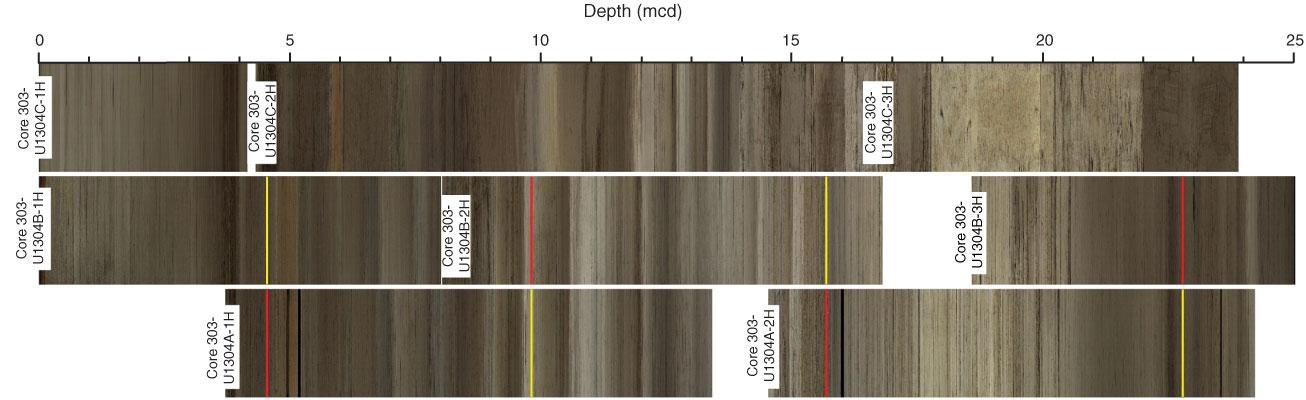
Figure F8. Detail from Figure F7. Red bars = top of an interval used in composite depth scale., yellow = bottom of interval. Note several misalignments between features within and outside of the composite.
Previous | Close | Next | Top of page