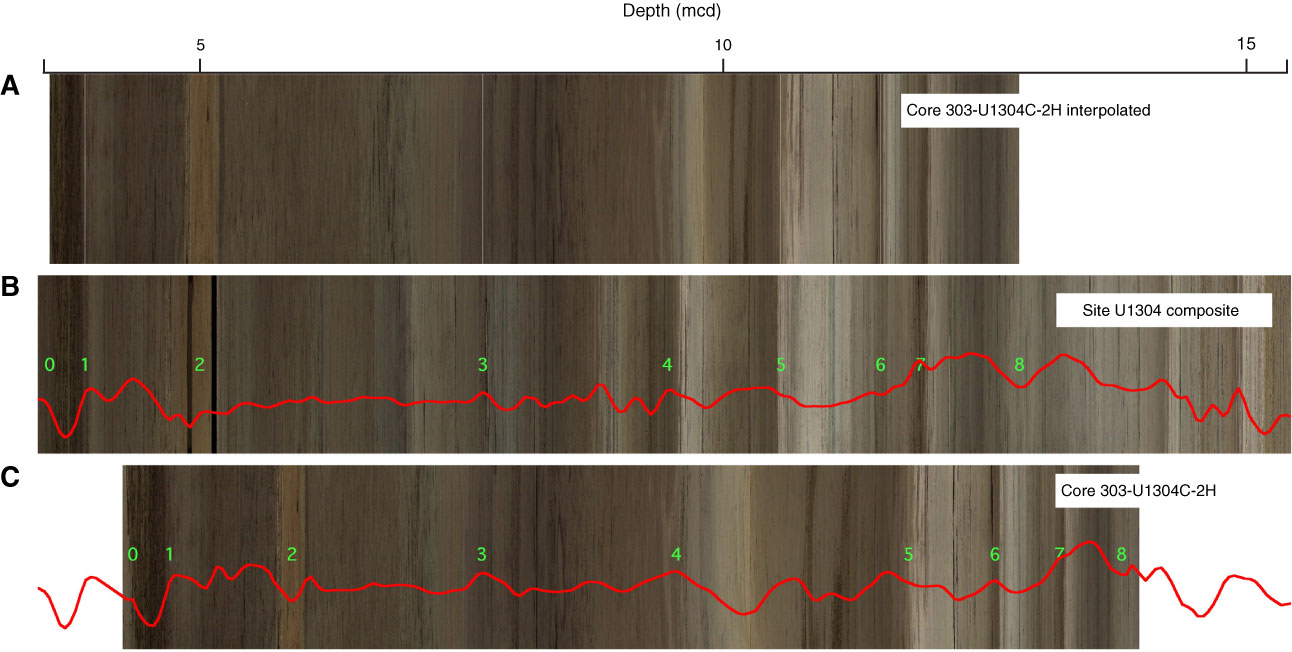
Figure F9. (C) Image of Core 303-U1304C-2H compared to (B) composite site image. Green numbers = tie points. (A) Another view of Core 303-U1304C-2H interpolated to match composite image using tie points. Red line = magnetic susceptibility.
Previous | Close | Next | Top of page