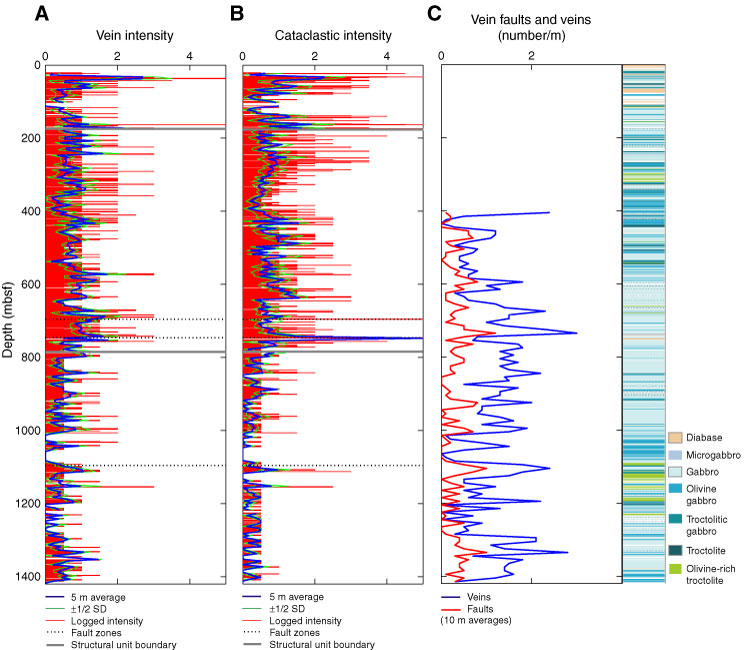
Figure F182. Downhole plots of brittle features in Hole U1309D. A. Vertical distribution of vein abundance, estimated from core observations, is relatively constant throughout the interval cored during Expedition 305, with possible vein intensity peaks at ~575 mbsf and at 700–750 mbsf. There is a relatively abrupt decrease in the background vein intensity below the fault zone at ~750 mbsf. This vein intensity log does not include the serpentine foliation. B. Cataclastic deformation, estimated from core observations, is overall very low. Similar to the veins, there is an increase between 450 and 750 mbsf, followed by a relatively abrupt decrease in the intensity of cataclastic deformation at ~750 mbsf. C. Average number of logged veins (blue) and fault veins (red) per meter, using a 10 m averaging window determined from the metamorphic petrologists during Expedition 305. This log includes the serpentine foliation. Fault zones identified during Expedition 305.
Previous | Close | Next | Top of page