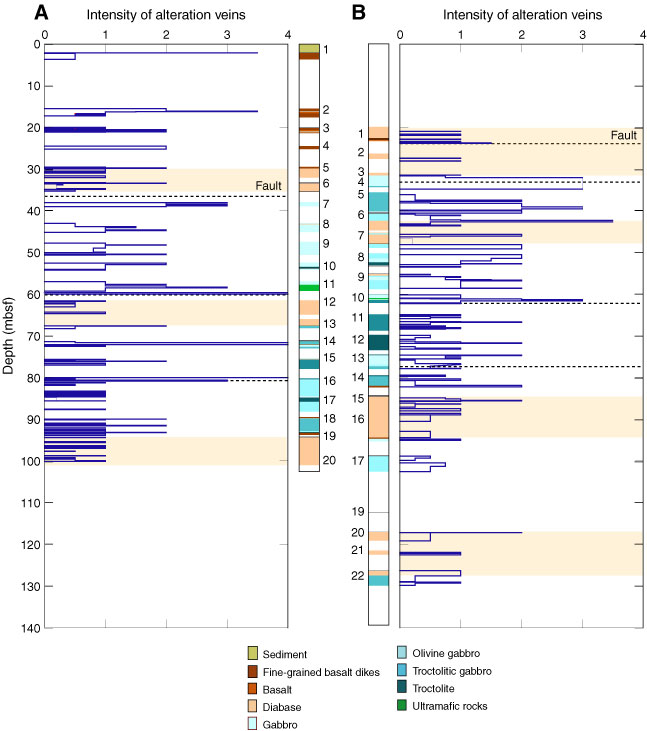
Figure F183. Downhole plot of absolute intensity of alteration veins in Holes (A) U1309B and (B) U1309D to 132 mbsf (Expedition 304). Diabase is highlighted (beige) across the figures to depict the generally lower intensity in those intervals. Dotted lines = location of inferred faults based on cataclastic fabrics.
Previous | Close | Next | Top of page